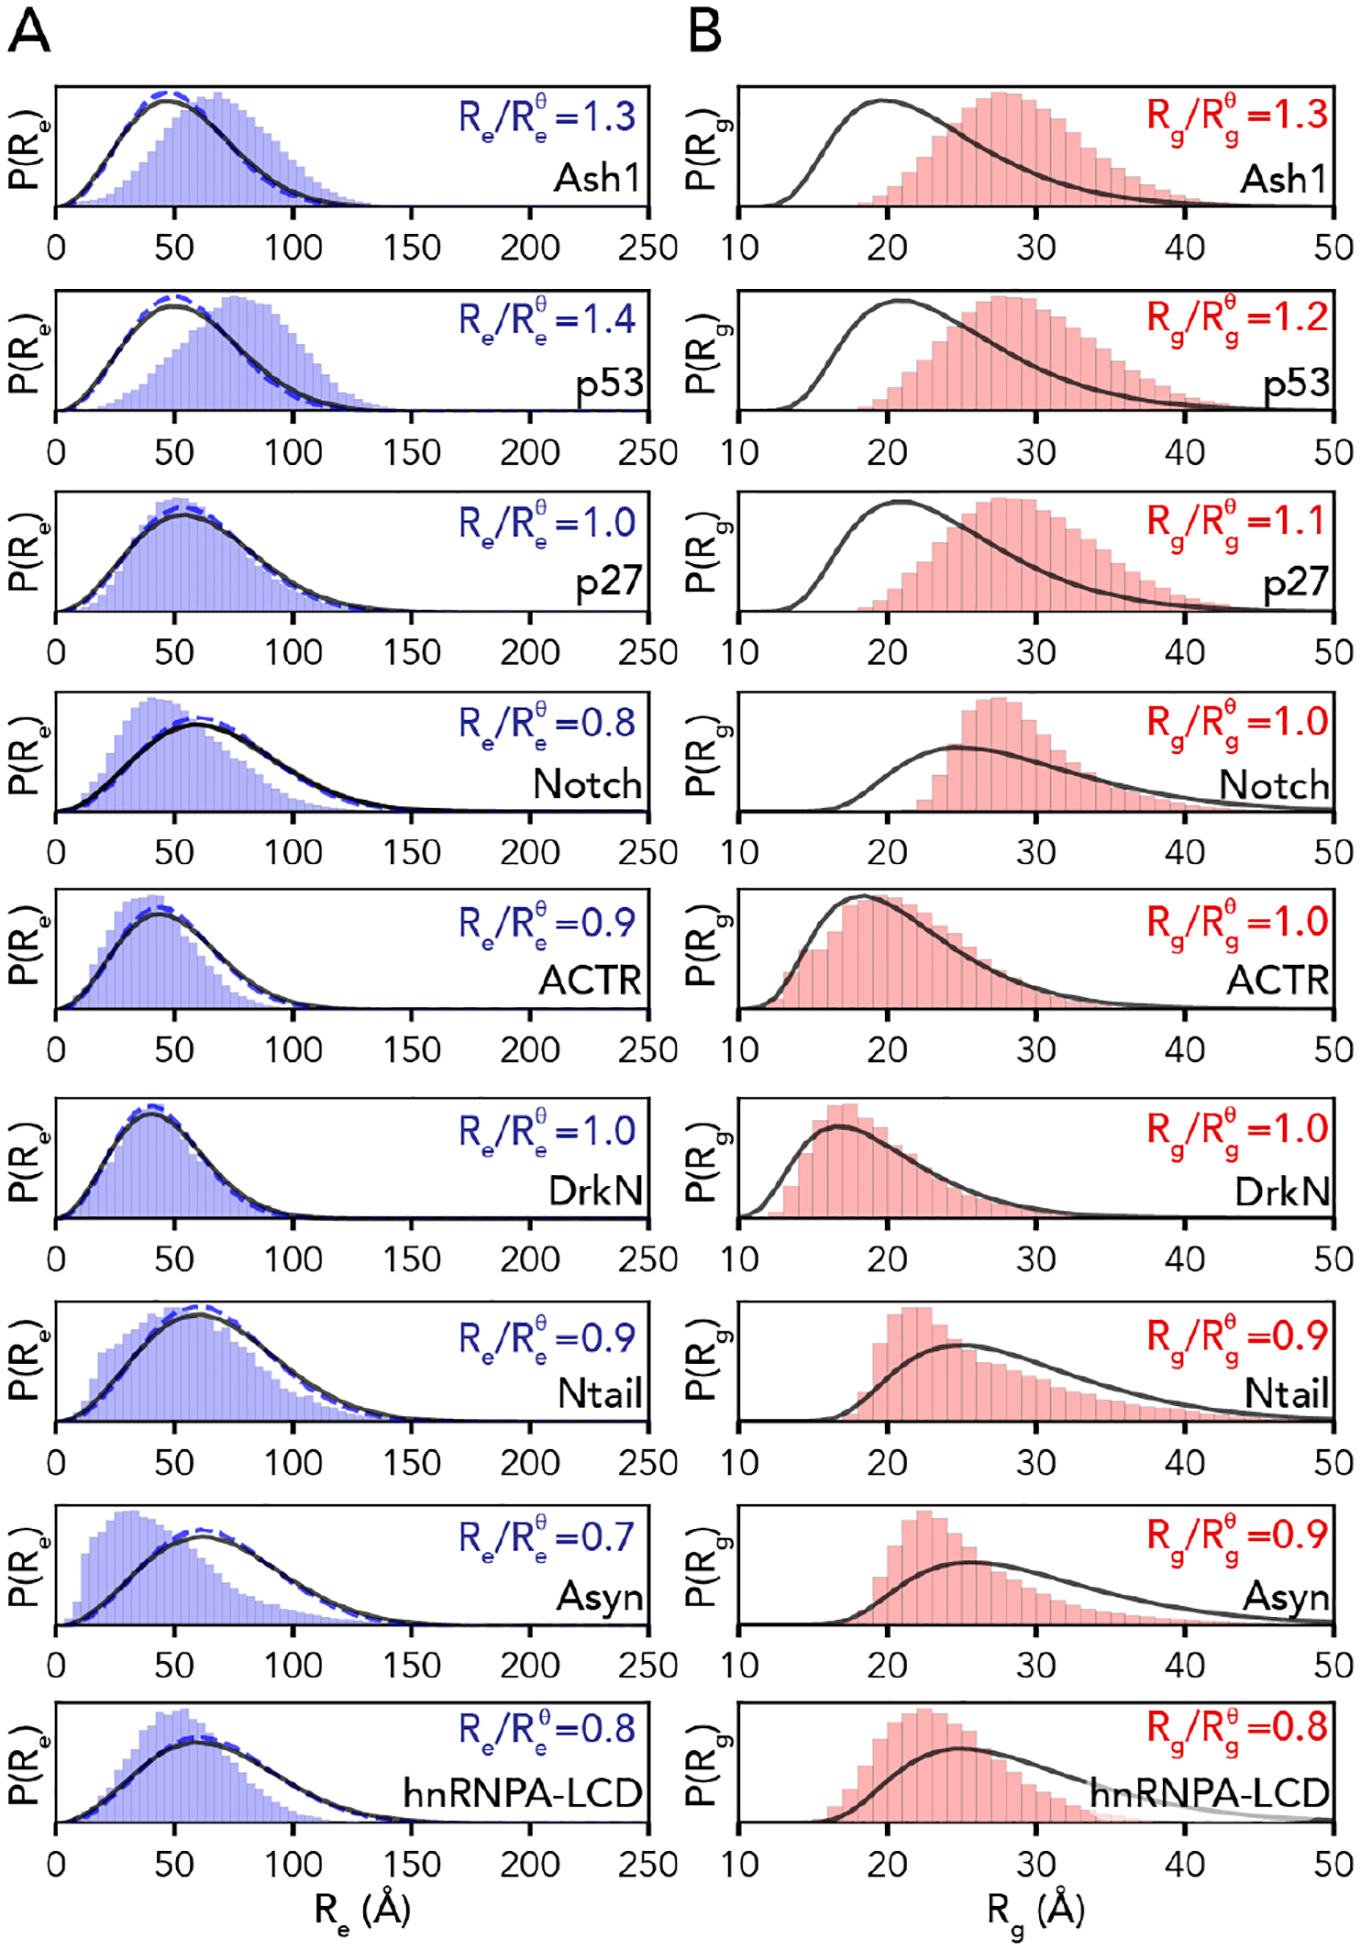
Fig. 5. AFRC-derived distance distributions enable simulations to be qualitatively compared against a null model.

A. Comparison of the end-to-end distance distributions from the AFRC (black line) and SAW-ν (blue dashed line, with ν=0.5 and prefactor = 5.5) with the simulation-derived end-to-end distribution (blue bars) for all-atom simulations of nine different disordered proteins. B. Comparison of the AFRC-derived radius of gyration distributions (black line) with the simulation-derived radius of gyration distribution (red bars) for all-atom simulations of nine different disordered proteins.
