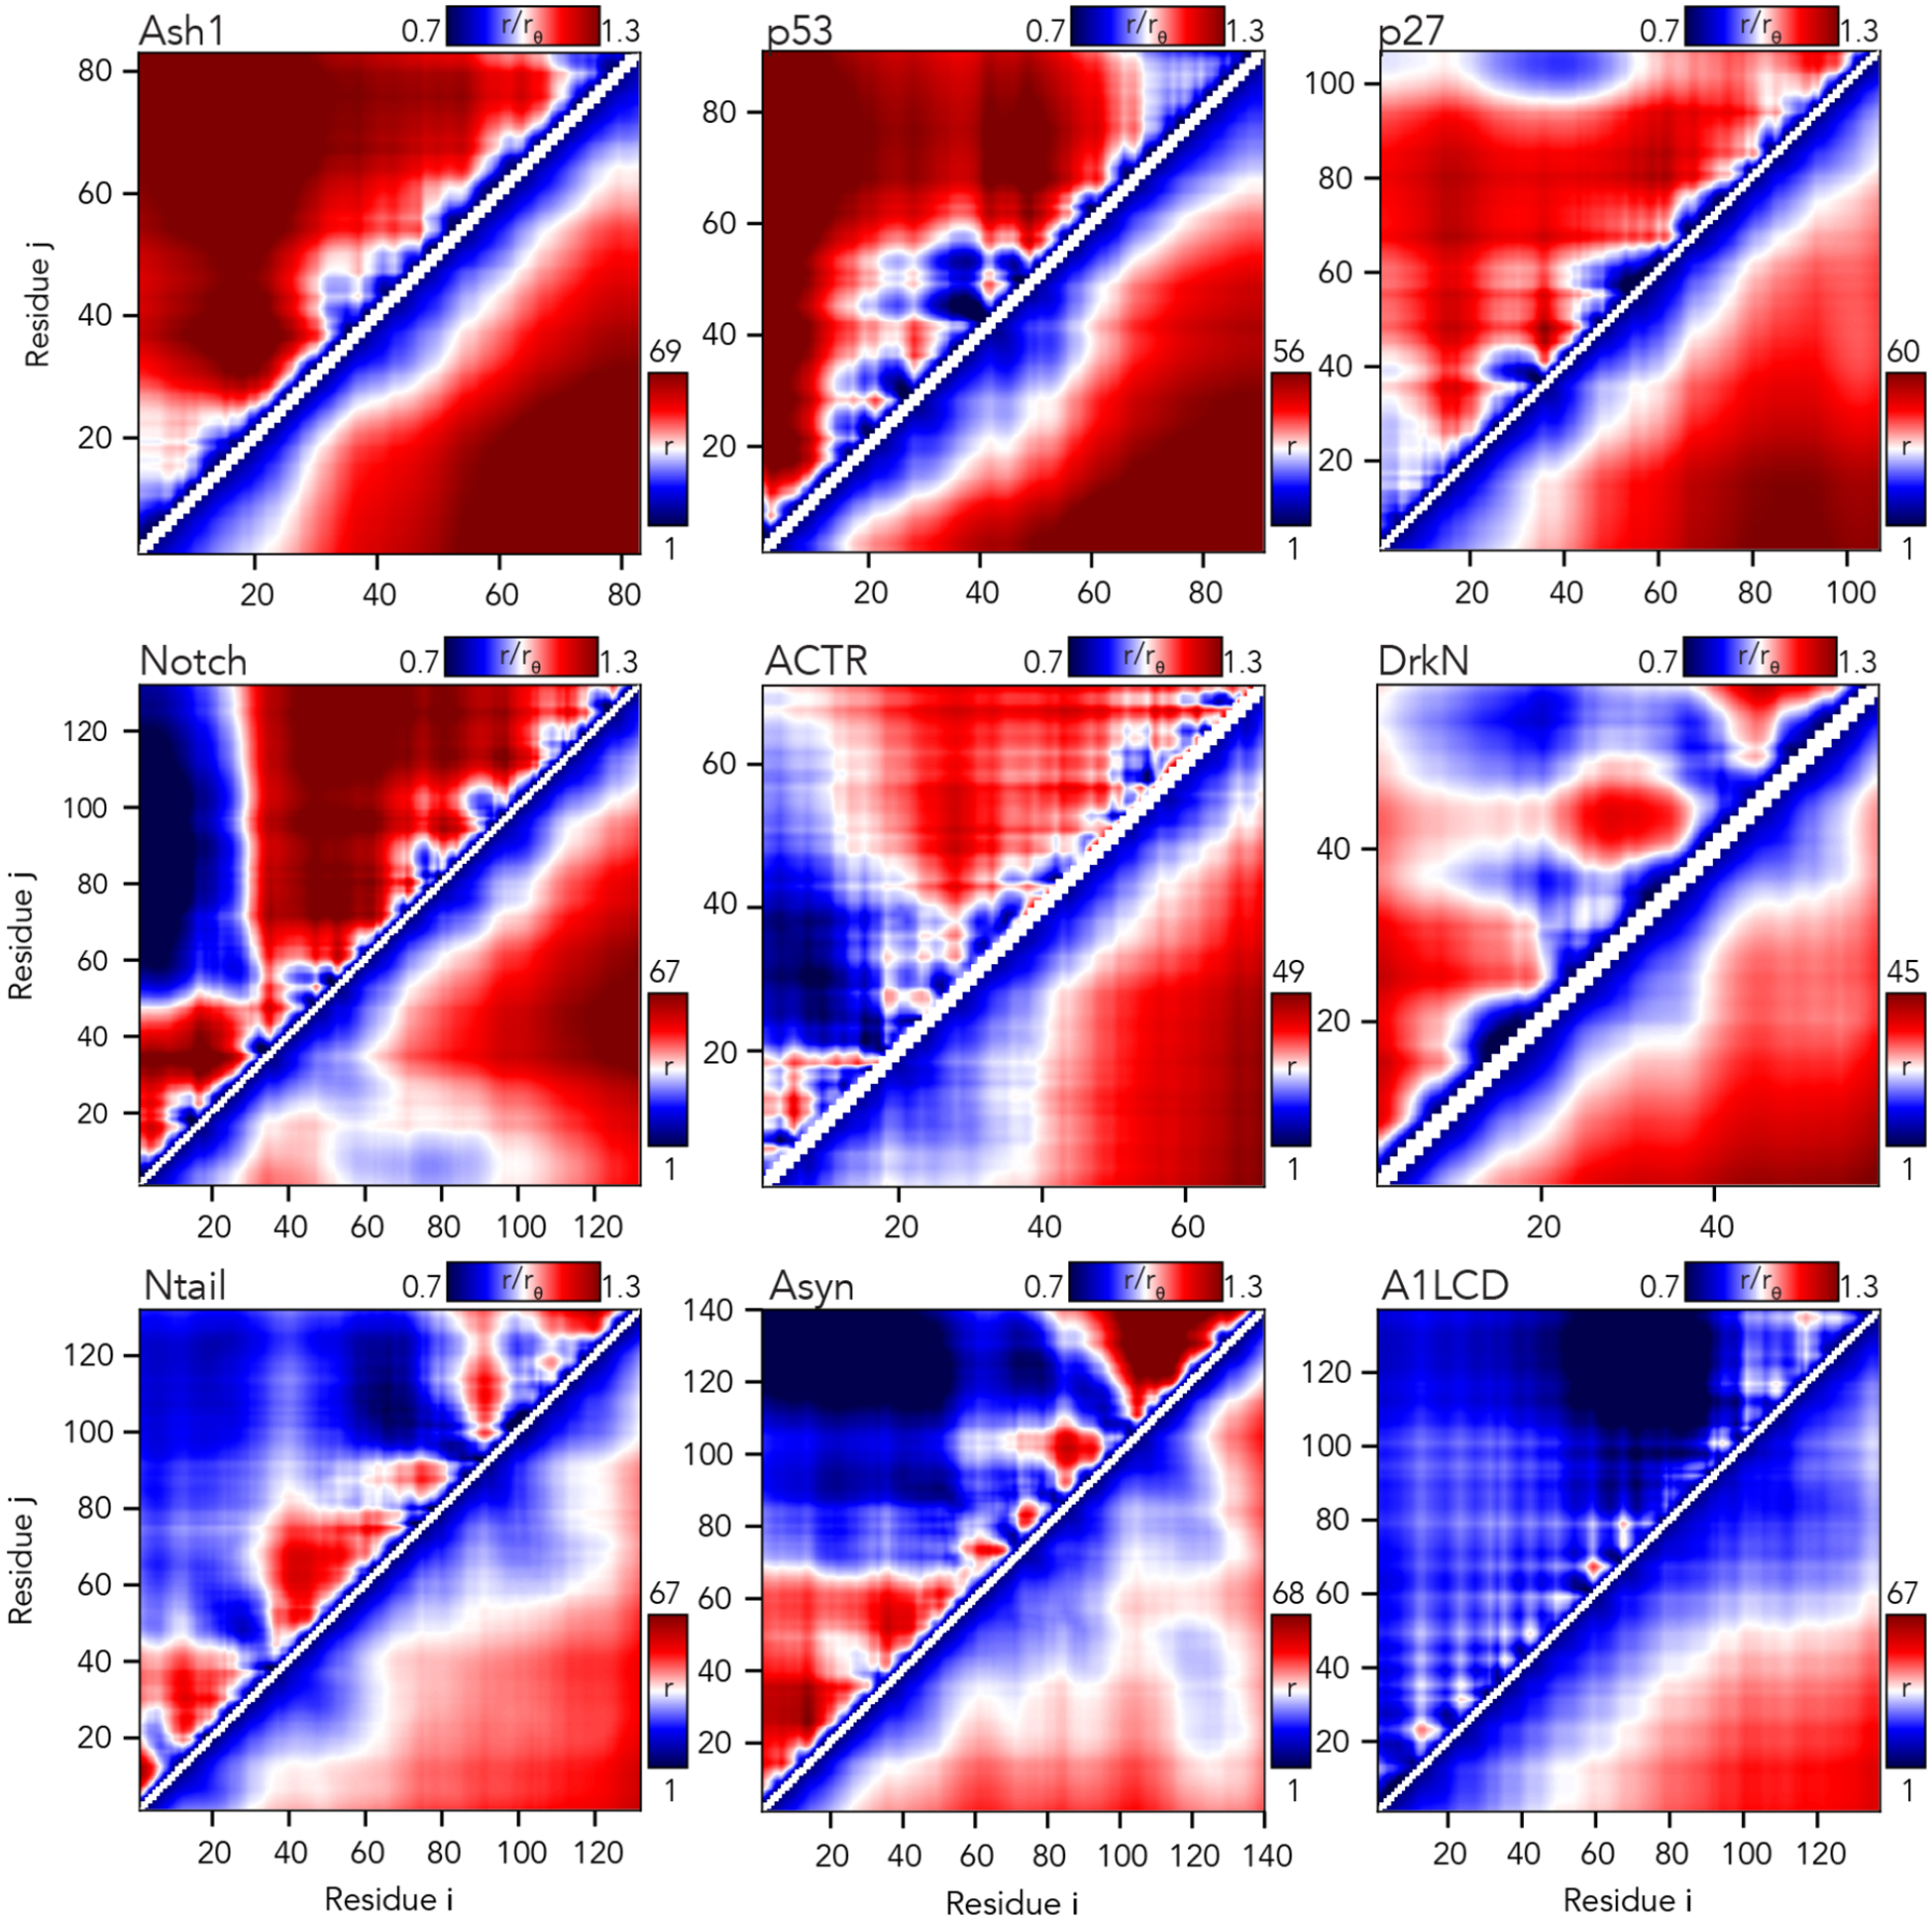
Fig. 6. The AFRC enables a consistent normalization of intra-chain distances to identify specific sub-regions that are closer or further apart than expected.

Inter-residue scaling maps (top left) and distance maps (bottom right) reveal the nuance of intramolecular interactions. Scaling maps (top left) report the average distance between each pair of residues (i,j) divided by the distance expected for an AFRC-derived distance map, providing a unitless parameter that varies between 0.7 and 1.3 in these simulations. Distance maps (bottom right) report the absolute distance between each pair of residues in angstroms. While distance maps provide a measure of absolute distance in real space, scaling maps provide a cleaner, normalized route to identify deviations from expected polymer behavior, offering a convenient means to identify sequence-specific effects. For example, in Notch and alpha-synuclein, scaling maps clearly identify end-to-end distances as close than expected. Scaling maps also offer a much sharper resolution for residue-specific effects - for example, in p53, residues embedded in the hydrophobic transactivation domains are clearly identified as engaging in transient intramolecular interactions, leading to sharp deviations from expected AFRC distances.
