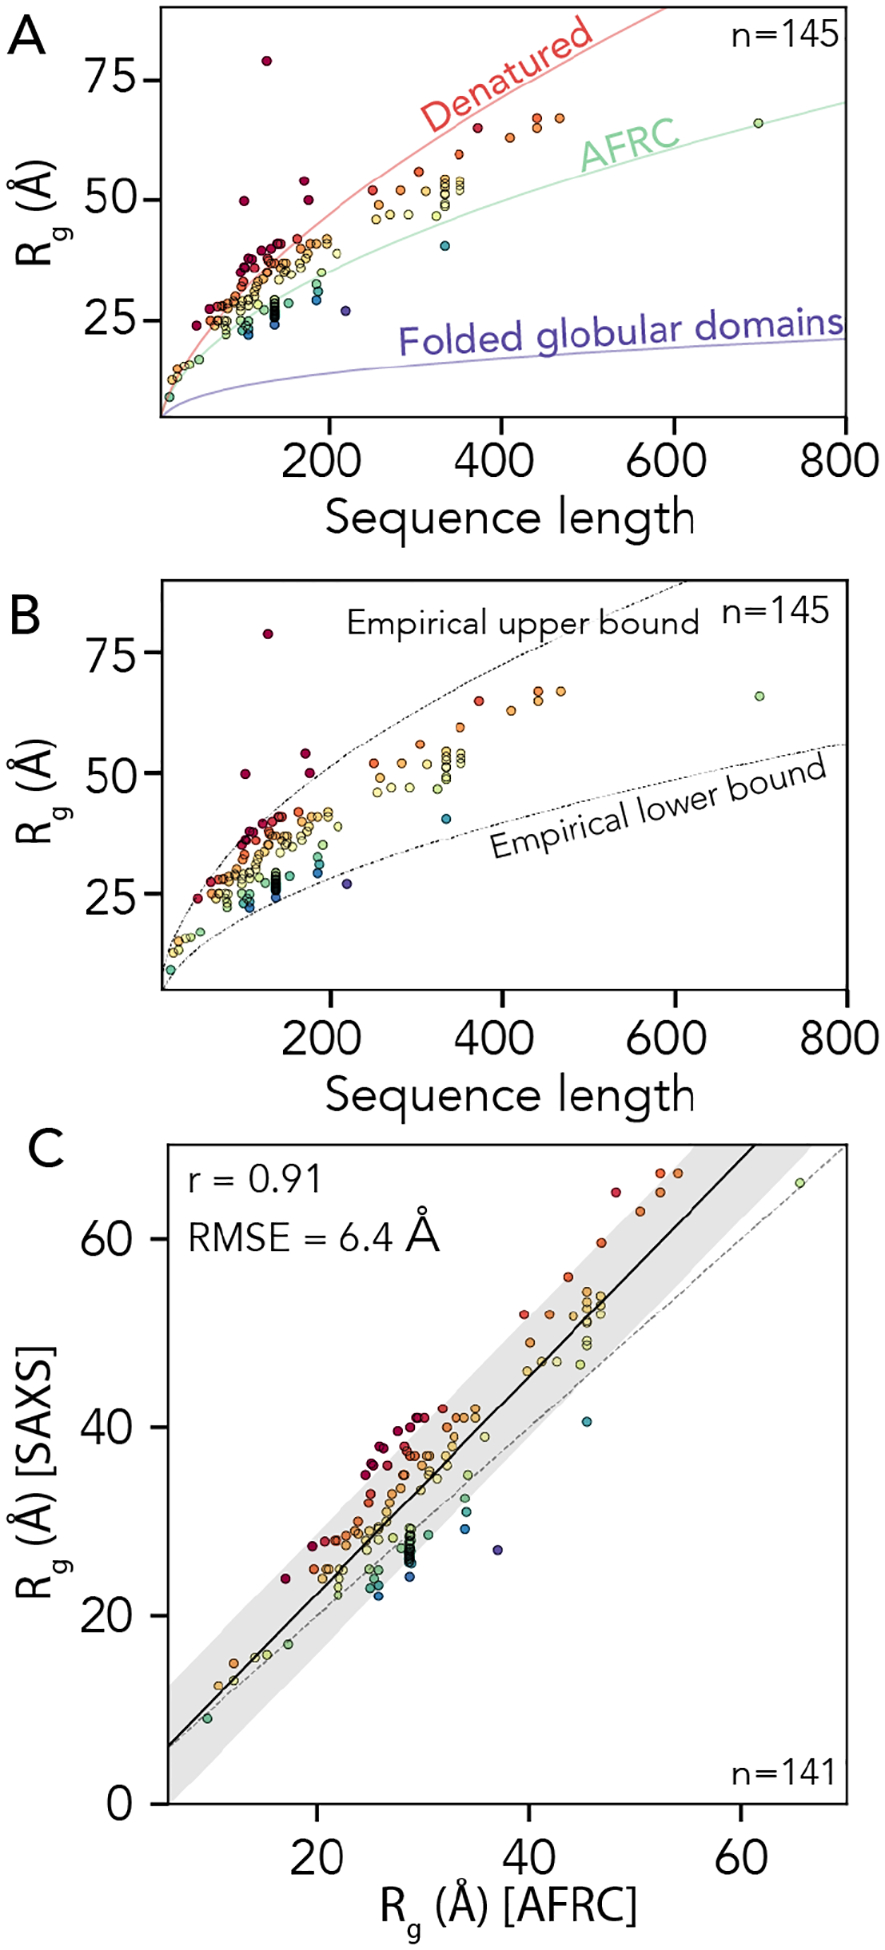
Fig 8. Comparison of AFRC-derived radii of gyration with experimentally-measured values.

A. We compared 145 experimentally-measured radii of gyration against three empirical polymer scaling models that capture the three classes of polymer scaling (ν = 0.33 [globular domains], ν = 0.5 [AFRC], and ν = 0.59 [denatured state]). Individual points are colored by their normalized radius of gyration (SAXS-derived radius of gyration divided by AFRC-derived radius of gyration). B. The same data as in panel A with the empirically defined upper and lower bound. As with panel A, individual points are colored by their normalized radius of gyration. C. Comparison of SAXS-derived radii of gyration and AFRC-derived radii of gyration, as with panels A and B, individual points are colored by their normalized radius of gyration.
