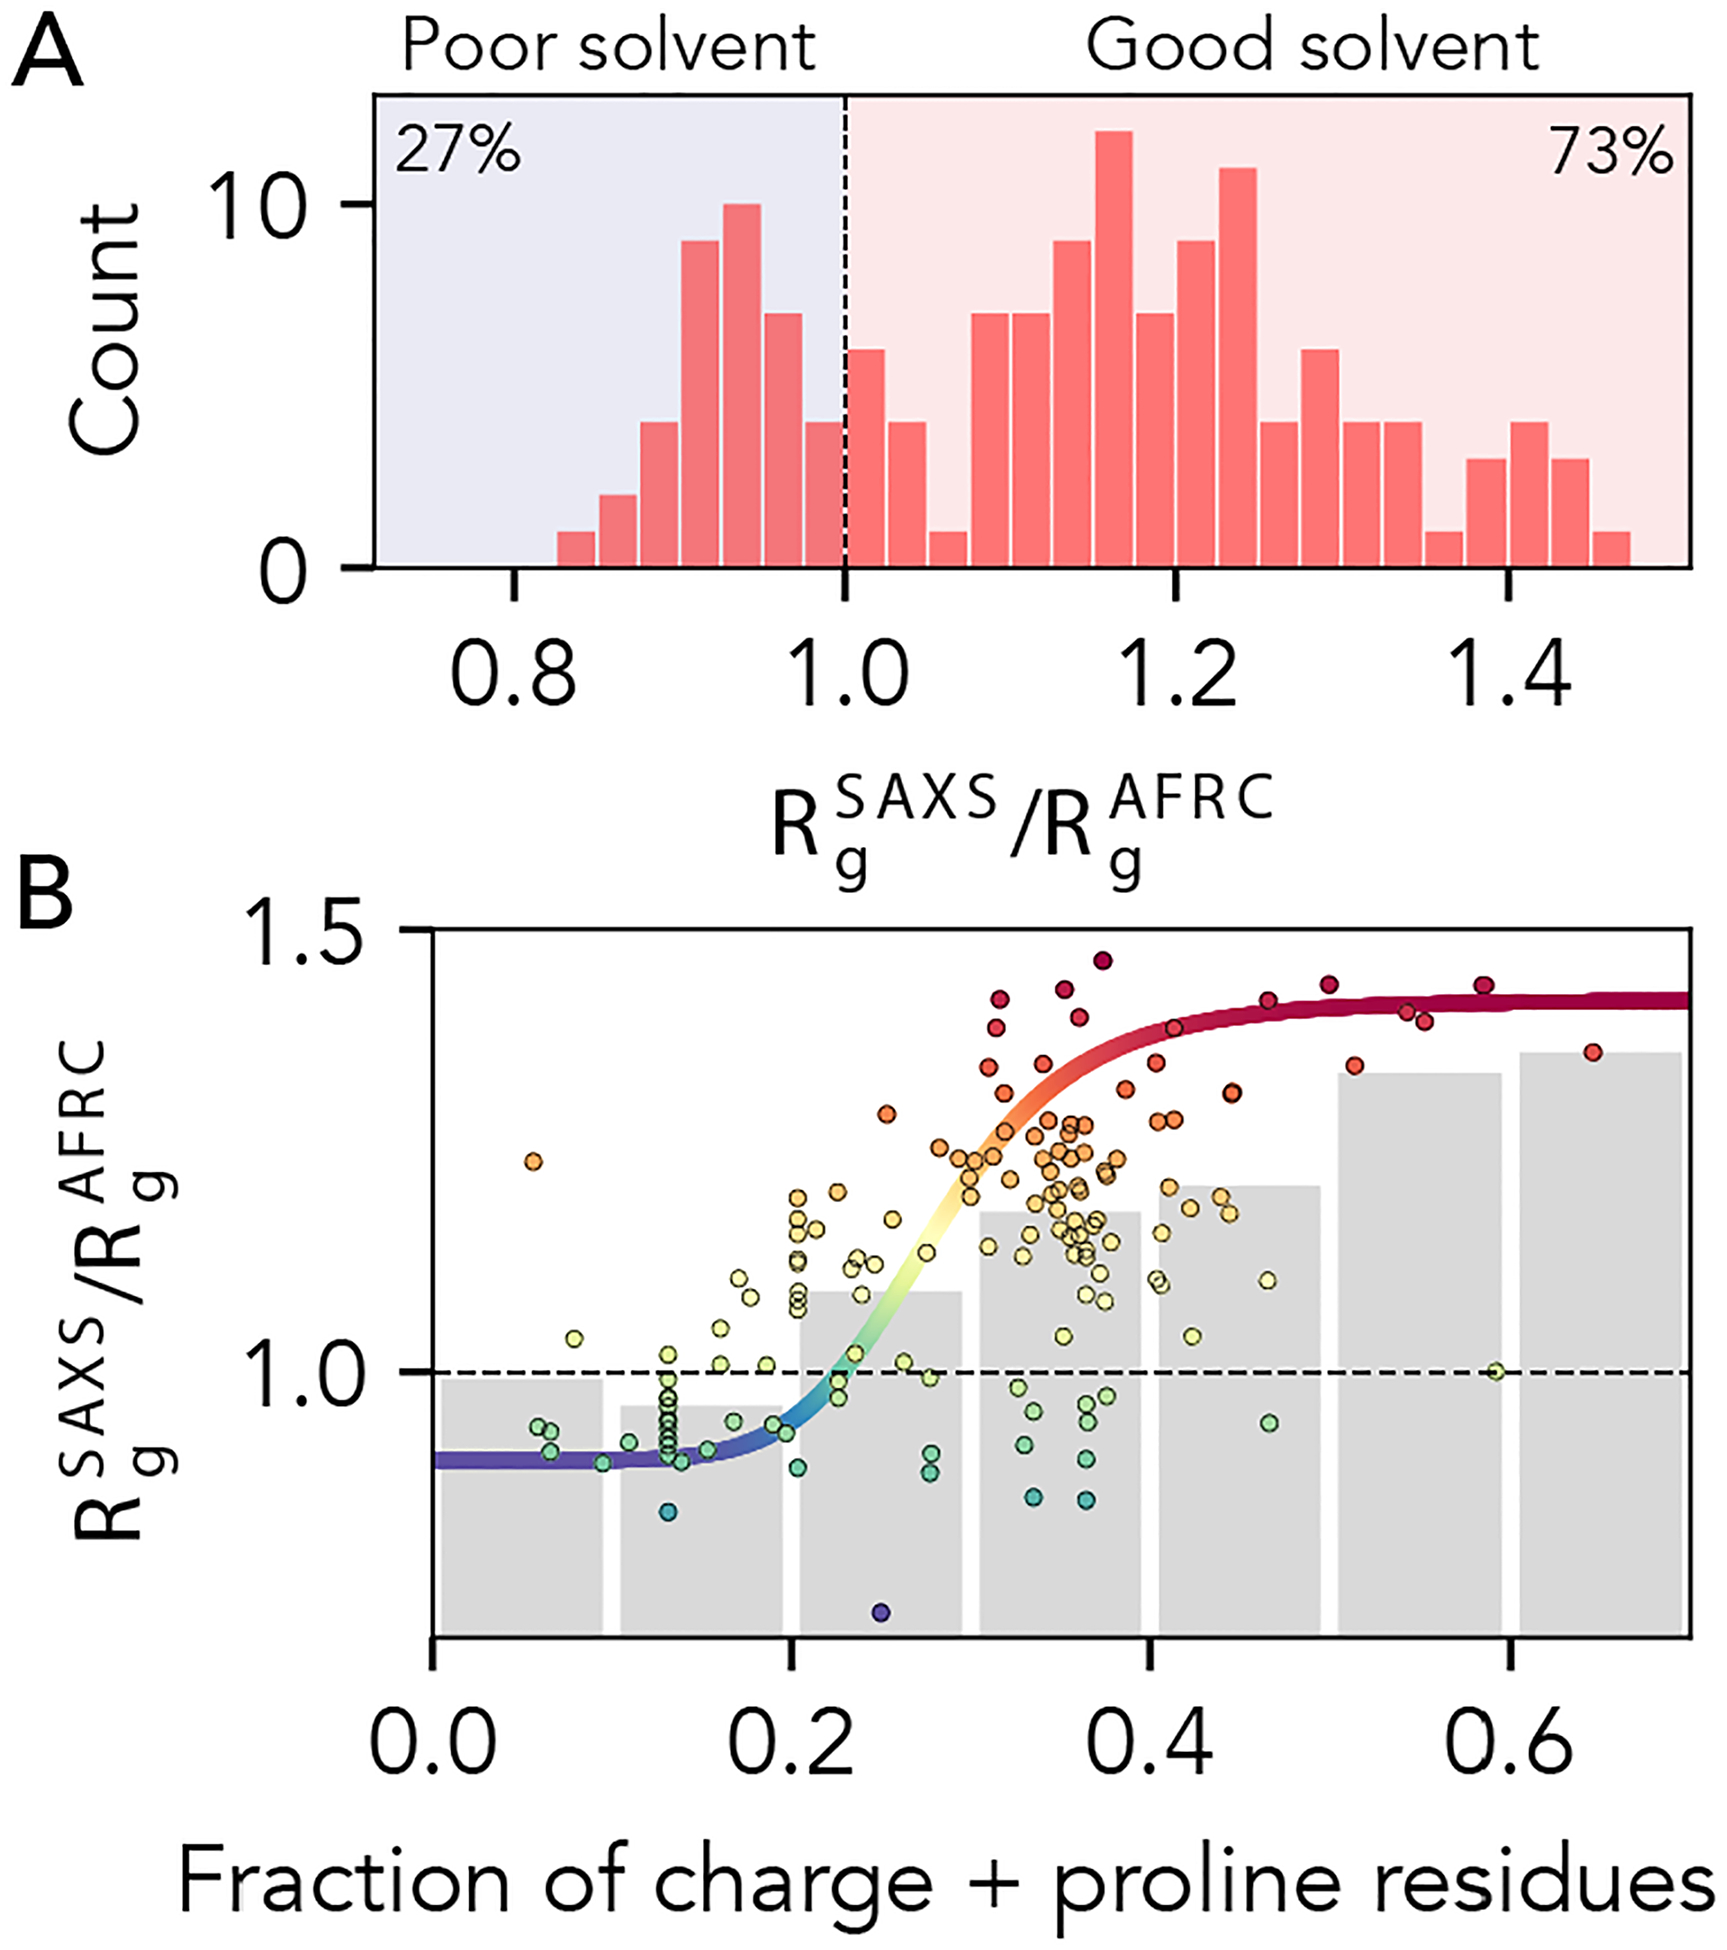
Fig 9. AFRC-normalized radii of gyration from experimentally-measured proteins.

A. Histogram showing the normalized radii of gyration for 141 different experimentally-measured sequences. B. Comparison of normalized radii of gyration for 141 different experimentally-measured sequences against the fraction of charge and proline residues in those sequences. Individual points are colored by their normalized radius of gyration. Grey bars reflect the average radius of gyrations obtained by binning sequences with the corresponding fraction of charge and proline residues. The colored sigmoidal curve is included to guide the eye across the transition region, suggesting that – on average – the midpoint of this transition is at a fraction of charged and proline residues of ~0.25. The Pearson correlation coefficient (r) for the fraction of charged and proline residues vs. normalized radius of gyration is 0.58).
