Fig. 3.
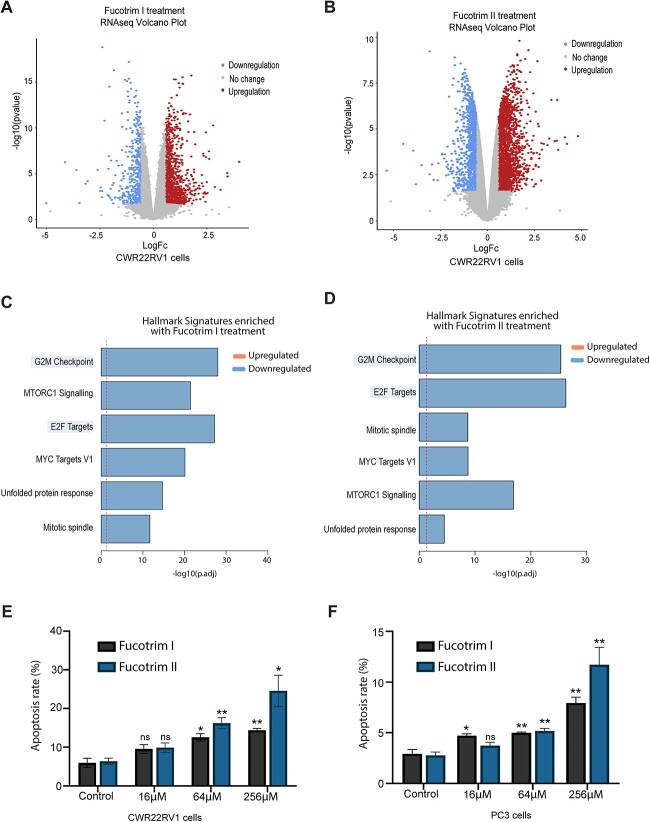
Inhibition of fucosylation in prostate cancer cells using Fucotrim I and Fucotrim II downregulates cell cycle gene expression signatures and induces apoptosis. A) Volcano plot of RNA-seq data to show 1,354 genes that are differentially expressed in CWR22RV1 cells in response to treatment with 30 μM Fucotrim I for 72 h (log2FC > |0.58| + adjusted P-value < 0.05). B) Volcano plot to show 3,677 genes that are differentially expressed in CWR22RV1 cells in response to treatment with 60 μM Fucotrim II for 72 h (log2FC > |0.58| + adjusted P-value < 0.05). C, D) Ensemble gene set enrichment analysis of genes regulated by Fucotrim I and Fucotrim II reveals downregulation in the “G2M checkpoint” and “E2F targets” hallmark signatures. (E, F) Annexin V flow cytometry shows treatment of CWR22RV1 and PC3 cells with a range of concentrations of Fucotrim I or Fucotrim II induces apoptosis.

