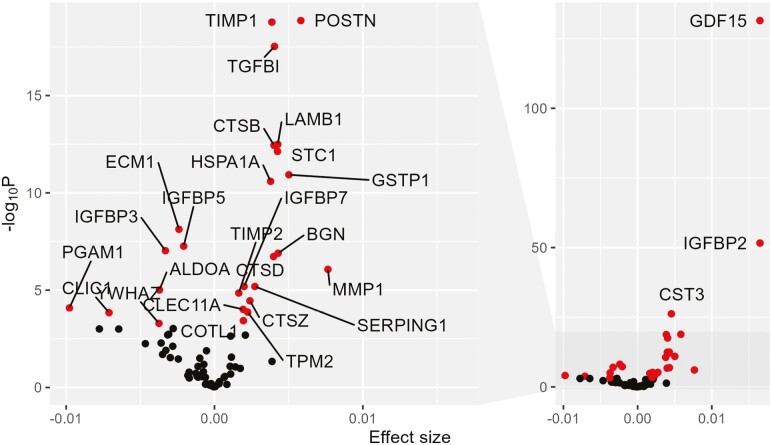
Figure 2.
Volcano plot of SASP age associations. Effect size of age association on the x-axis, and significance of the age association represented as the -log10p value of the age association on the y-axis. Full plot of the right-side labeling top 3 SASP age associations, and zoomed plot of lower segment of y-axis on the right side. Black points = not significantly associated after multiple testing with age. Red points = significantly associated after multiple testing with age. Gene names label red points.

