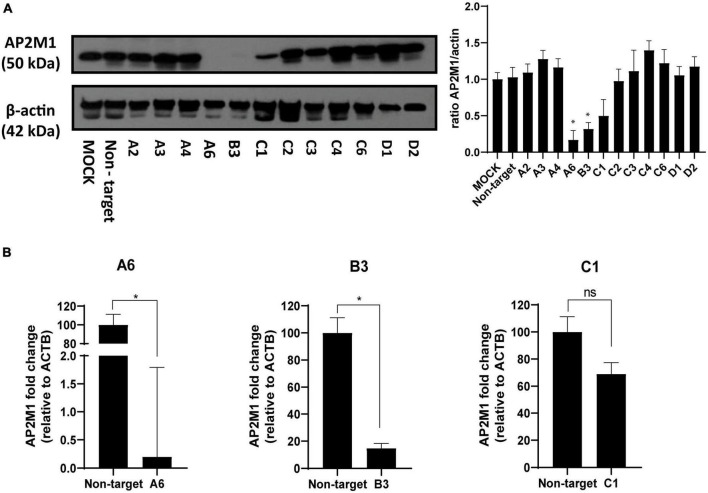
FIGURE 3.
Determination of AP2M1 shRNA knockdown efficiency in PK15 cells. PK15 cells were transfected with a pool of shRNA to KD the expression of AP2M1. KD efficiency was checked by both Western blot and RT-qPCR. (A) Western blot analysis of total cell lysates subjected to SDS-PAGE showing AP2M1 for each condition. β-actin was chosen as protein loading control. Values of immunoblot quantification are reported as the mean ± S.D. (n = 3); *p < 0.05. (B) qPCR amplification of AP2M1 mRNA from AP2M1 A6, B3, and C1 shRNA-treated PK15 cells in comparison to the non-targeted control. mRNA level is relative to β-actin (ACTB) control (n = 6, mean ± S.D.). *p < 0.05 was considered as statistically significant compared to the non-targeting shRNA-transfected cells.

