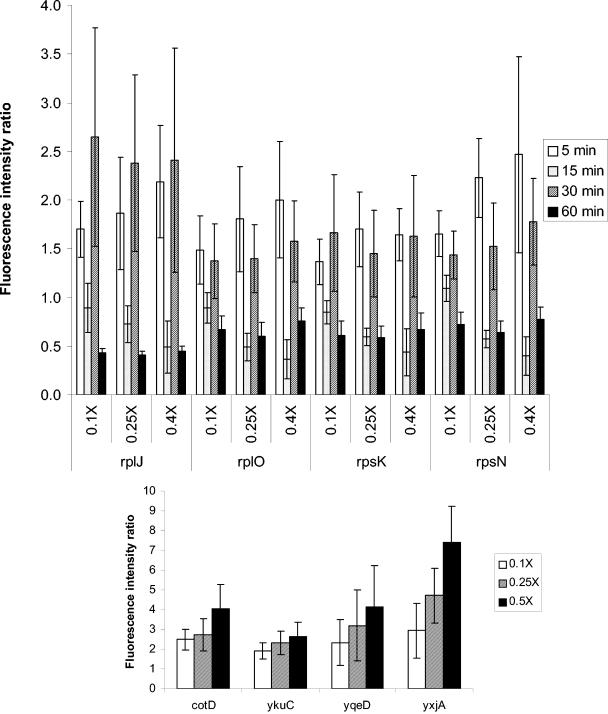
FIG. 2.
Average gene expression ratios upon treatment with gentamicin or erythromycin. (Top panel) Average expression ratios of rplJ, rplO, rpsK, and rpsN genes upon treatment with 0.1×, 0.25×, or 0.4× MIC of gentamicin for 5, 15, 30, or 60 min. (Bottom panel) Dose-dependent expression ratios of cotD (spore coat protein), ykuC (similar to macrolide-efflux protein), yqeD (unknown), and yxjA (similar to pyrimidine nucleoside transport) genes upon treatment with 0.1×, 0.25×, or 0.5× MIC of erythromycin for 15 min. Values of more than one indicate induction, and values of less than one indicate repression. The error bars depict the standard deviation from 12 datum points in two independent experiments.

