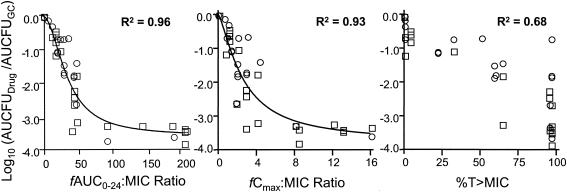
FIG. 3.
Relationships between gatifloxacin fAUC0-24/MIC ratio (left), fCmax/MIC ratio (middle), and T>MIC (right) for two strains of serovar Typhi with differing MICs and changes in bacterial density. The square symbols represent a strain with a gatifloxacin MIC of 0.5 μg/ml, while the circles represent a strain with a gatifloxacin MIC of 4 μg/ml. GC, growth control.

