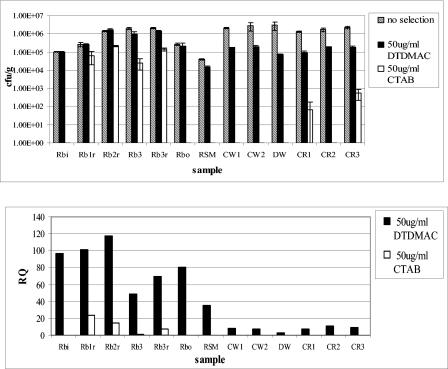
FIG. 3.
Relative resistance to DTDMAC and CTAB at 50 μg/ml. (Top) Viable plate counts, with error bars giving standard deviations. (Bottom) RQs showing percentages of resistant bacteria in each sample. Rbi, reed bed inlet; RB1 to RB3, reed beds 1 to 3; r, root-associated sample material; Rbo, reed bed outlet; RSM, river sediment downstream of outfall; CW1 and CW2, Cotswold farmland soil; DW, Droitwich farmland soil; CR1 to CR3, Warwickshire farmland soil (Cryfield).

