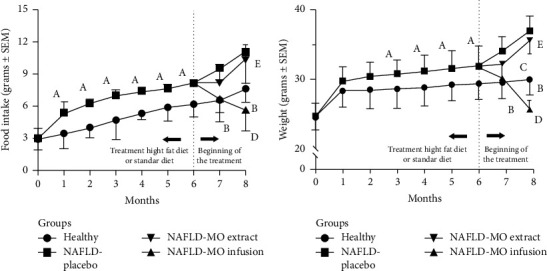
Figure 2.

Food intake and body weight evolution in the groups. (a) Food intake; (b) body weight evolution. All values are expressed as mean ± SEM, (n = 11); the differences of Tukey's post hoc analysis are marked when they are significant: Ap ≤ 0.05, healthy vs. NAFLD model genesis, Bp ≤ 0.05, healthy vs. NAFLD-placebo, Cp ≤ 0.05, healthy vs. NAFLD-MO infusion, Dp ≤ 0.05, NAFLD-placebo vs. NAFLD-MO infusion, and Ep ≤ 0.05, NAFLD-MO extract vs. NAFLD-MO infusion. The comparisons between NAFLD-placebo vs. NAFLD-MO extract and healthy vs. NAFLD-MO extract did not show statistically significant differences at a significance level of p ≤ 0.05.
