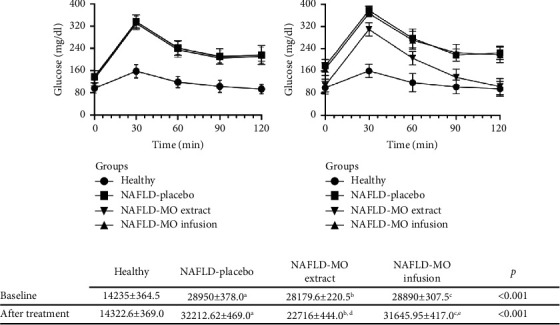
Figure 3.

Glucose tolerance curve in the groups. (a) Baseline: before starting the treatments, the healthy group obtained significantly lower glucose levels (at all measurement times, basal, 0, 30, 60, 90, and 120 minutes compared to all NAFLD groups (p < 0.001). (b) After treatment: at the end of the treatment with MO. (c) AUCs of glucose levels (mg.min/dl) calculated according to trapezoid rules with those from OGTT. All values are expressed as mean ± SEM, and differences from paired t-test analysis are marked when they are significant: Ap < 0.05, healthy vs. NAFLD-placebo, Bp < 0.05, healthy vs. NAFLD-MO ethanolic extract, Cp < 0.05, healthy vs. NAFLD-MO infusion, Dp < 0.05, NAFLD-placebo vs. NAFLD-MO ethanolic extract, and Ep < 0.05, NAFLD-MO ethanolic extract vs. NAFLD-MO infusion. n = 11 per group.
