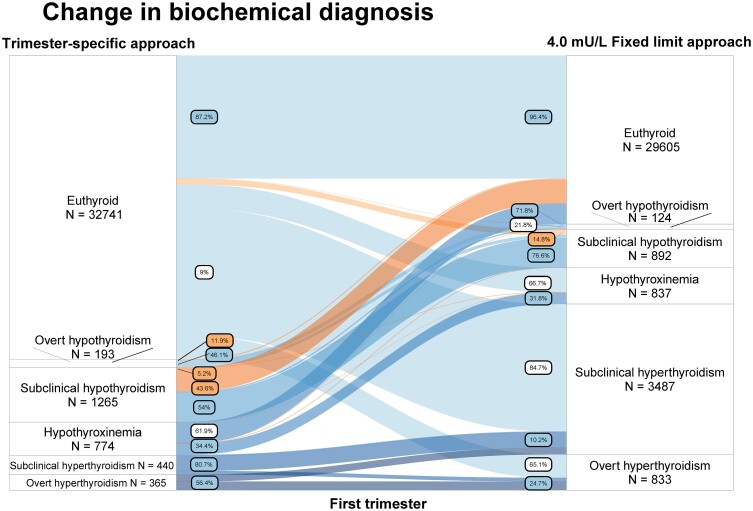
Figure 4.
Change in diagnosis comparing the trimester-specific reference intervals (left; using 2.5th and 97.5th percentile in TPOAb-negative women) and the subtraction approach (right; nonpregnancy reference intervals subtracting 0.5 mU/L from the upper limit for TSH). Labels indicate proportion of women for that specific thyroid function test abnormality who change to a certain other label. Orange labels and flow indicate a change in treatment recommendation, white labels indicate a change in biochemical diagnosis but with the same treatment recommendation, blue labels indicate proportion with the same biochemical diagnosis between methods.

