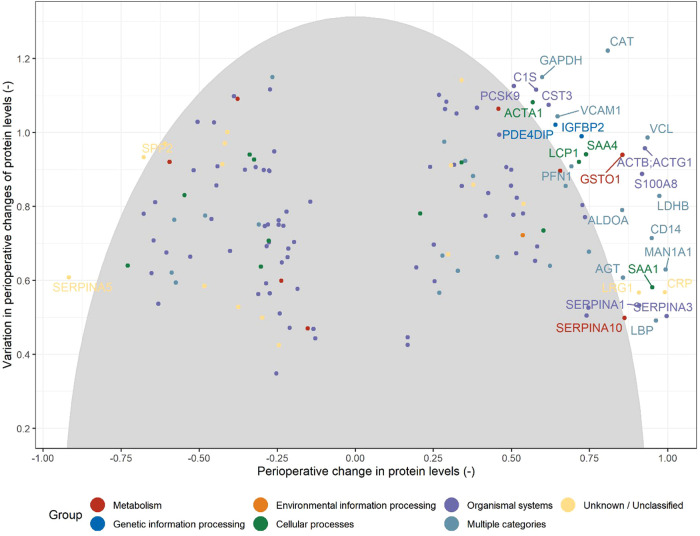
Figure 2.
Illustration of the selection of hit proteins from the set of candidate proteins (see Figure 1) based on the magnitude of the change from baseline (preoperative) values and the between-patient variation in the perioperative changes. Note that centered (by the median) and scaled (by the interquartile range) protein levels are used. The grey ellipse includes the 80% of proteins with the shortest distances in this two-dimensional space [e.g. distances below the 80% quantile of all distances: dq(0.8); see Methods]. Proteins are declared as hits when their corresponding values are above the threshold values [dq(0.8)].

