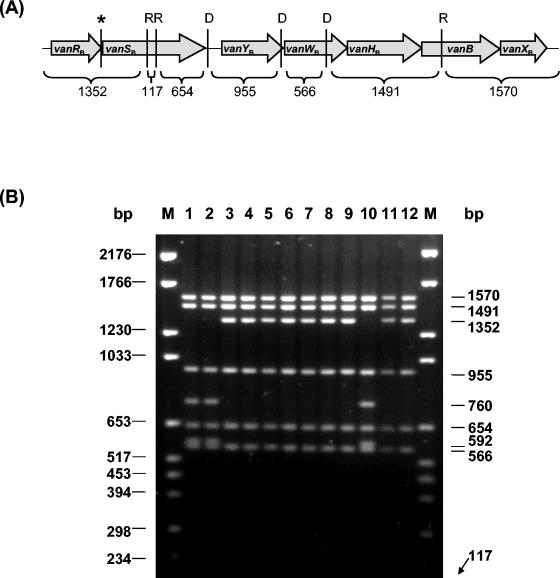
FIG. 2.
(A) Schematic diagram of the Tn1549-van PCR product. RcaI (R) and DraI (D) sites were deduced from the sequence of Tn1549 (GenBank accession no. AF192329). The sizes of the expected fragments are indicated in base pairs. The position of an additional RcaI site in C. hathewayi strains is indicated by an asterisk. Arrows denote the relative positions and sizes of coding regions within the operon. (B) RFLP analysis of Tn1549-van PCR amplicons. Amplicons were digested with RcaI (R) and DraI (D). Lanes: 1, MLG392; 2, MLG661; 3, MLG043; 4, MLG055; 5, MLG080-1; 6, MLsG080-3; 7, MLG101; 8, MLG245; 9, MLG480; 10, MLG856-1; 11, MLG856-2; 12, MLG229; M, Molecular DNA Marker VI (Roche Diagnostics). The sizes of the molecular markers are shown to the left of the gel. The sizes of the fragments obtained are shown to the right of the gel.

