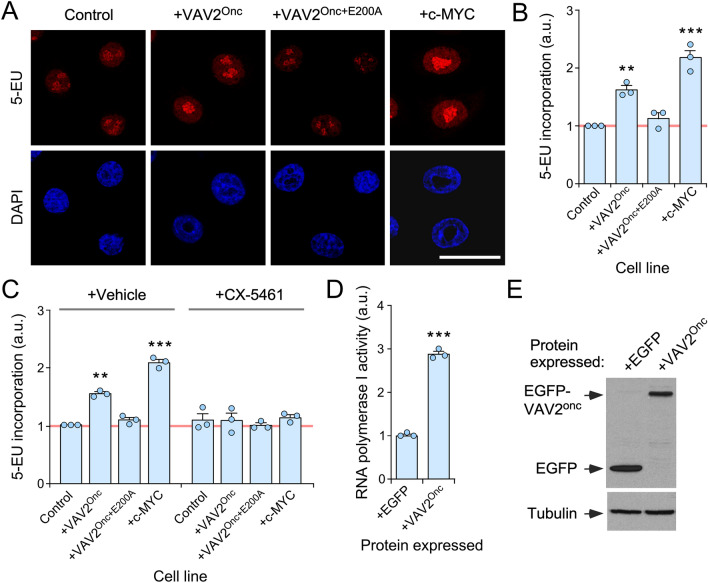
Figure 2.
VAV2Onc-driven epidermal hyperplasia is associated with enhanced ribogenesis. (A) Representative images of 5-EU-labeled (red, top panels) and DAPI-labeled (blue, bottom panel) human keratinocytes expressing the indicated proteins (top). Scale bar, 20 μm. (B) Quantitation of the 5-EU incorporation in the experiments shown in (A). **, P = 0.003; ***, P < 0.0001 of indicated test samples versus control cells (ANOVA and Dunnett’s multiple comparison test, n = 3 independent experiments). a.u., arbitrary units. (C) Quantitation of 5-EU incorporation in the indicated keratinocyte lines after inhibition of RNA polymerase I with CX-5461. Each point represents the mean fluorescence intensity of an independent experiment (n = 50 cells scored in each case). **, P = 0.006; ***, P < 0.0001 (experimental test vs controls) (ANOVA and Tukey’s HSD tests, n = 3 independent experiments). (D) Determination of RNA polymerase I activity of keratinocytes transiently expressing the indicated proteins using a luciferase reporter assay. Values were normalized to the experimental value obtained in EGFP-expressing cells (which was given an arbitrary value of 1). *, P = 0.017; ***, P < 0.0001 (ANOVA and Tukey’s HSD tests, n = 3 biological replicates). (E) Immunoblot showing the expression of the ectopically expressed proteins in one of the experiments performed in (D) (top panel). Tubulin α was used as protein loading control (bottom panel). Similar results were obtained in two independent experiments (not shown). In (B) to (D), data represent the mean ± SEM. Source data for this figure are provided as a Source Data file.

