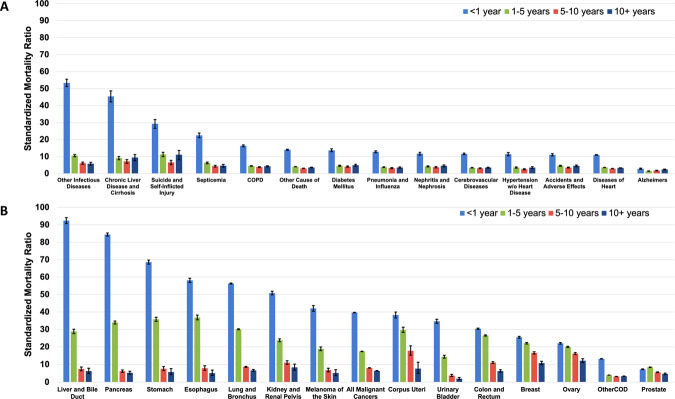
Fig. 5. Standardized mortality ratios (SMRs) of non-cancer death and primary-specific cancer subtypes.
The y-axis depicts the SMR with 95% CI, and the x-axis depicts A the leading causes of non-cancer death (total person-years at risk = 305,362.9) and B primary-specific cancer subtypes (total person-years at risk = 1,631,087.7, stratified by follow-up time. Different time periods after diagnosis (<1 year vs. 1–5 years vs. 5–10 years vs. >10 years) are shown in orange, yellow, green, and red, respectively. The risk of mortality is highest in the 1st year of diagnosis for all non-cancer deaths and primary-specific cancer subtypes. For most cancers and non-cancer deaths, the SMR subsides with longer follow-up time, but remains greater than the general population. The exact method was used to calculate the 95% CI, and error bars represent the 95% CIs by site. Source data are provided as a Source Data File.

