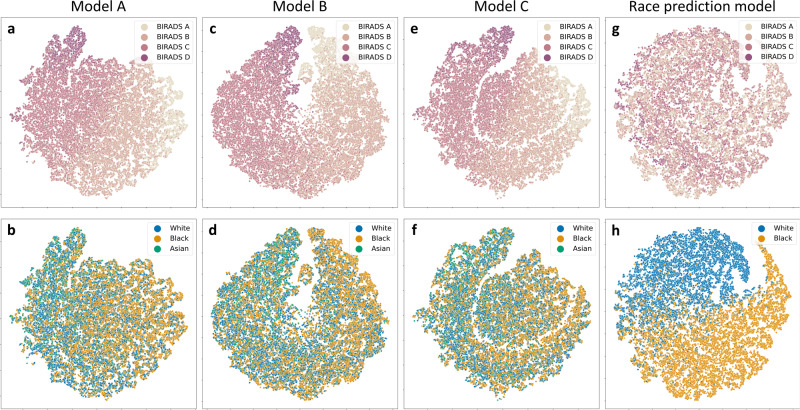
Fig. 3. t-SNE plots for density and race prediction models.
a–f Feature embeddings for different density prediction models. a, b Model A was trained on data from Black participants; c, d Model B was trained on data from White participants; e, f Model C was trained on data from both Black and White participants. a, c, e t-SNE plots with BI-RADS information overlaid. b, d, f t-SNE plots with race information overlaid. The density models encode a gradual transition across BI-RADS density classes while no obvious relationships appear between density and race information. g, h Feature embeddings for the race prediction model. g t-SNE plots with BI-RADS information overlaid. h t-SNE plots with race information overlaid. Here, race is well separated in the model’s feature space, but no obvious associations appear between race and breast density.

