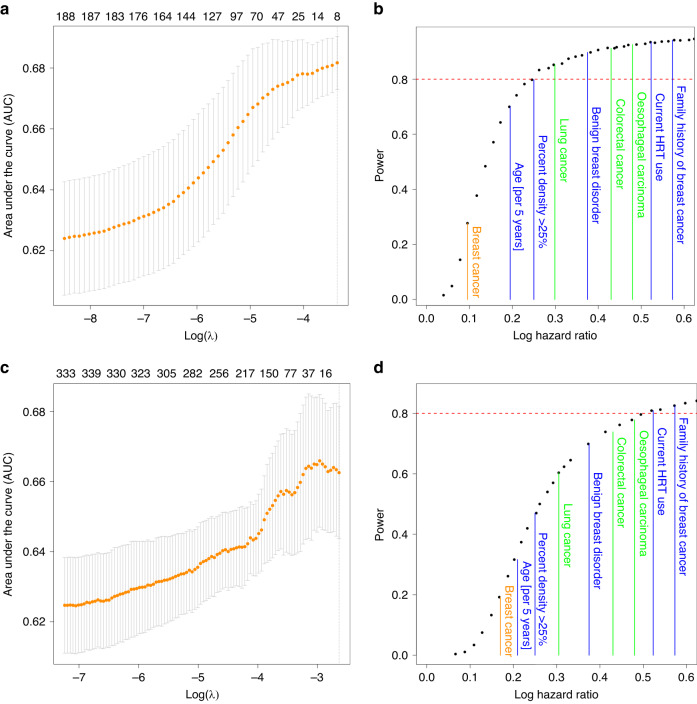
Fig. 4. Lasso regression and power analysis of the targeted and exploratory panel.
a (targeted), c (exploratory) We used lasso regression to quantify the potential impact of proteins on the accuracy to predict incident breast cancer. While accounting for (and thus not regularising) known breast cancer risk factors, we computed the area under the receiver operating curve (AUC) for each model using a fivefold cross-validation. The mean AUC as well as the standard error of the AUC estimate from the five cross validations is plotted against the penalty parameter λ and the number of proteins/parameters in the model (numbers at the top). Generally, adding proteins to the model did not improve prediction accuracy. b (targeted), d (exploratory) The power to detect proteins significantly associated with BC was estimated from generating random data with distributions similar to the observed data. By artificially increasing the effect size, we estimated at which effect size we would have had a power of 80% (red line) to detect significant effects (i.e., observed a Bonferroni corrected P value below 0.05). The effect sizes of known risk factors for breast cancer are indicated in blue. In green, we highlighted the average absolute effect sizes observed for nominally significant proteins (P < 0.05) for other cancers such as Oesophageal Squamous Cell Carcinoma [36], Colorectal Cancer [36] and Lung Cancer [37] from previous publications. The average absolute effect size observed for proteins with P < 0.05 in our dataset for Breast Cancer are shown in orange.

