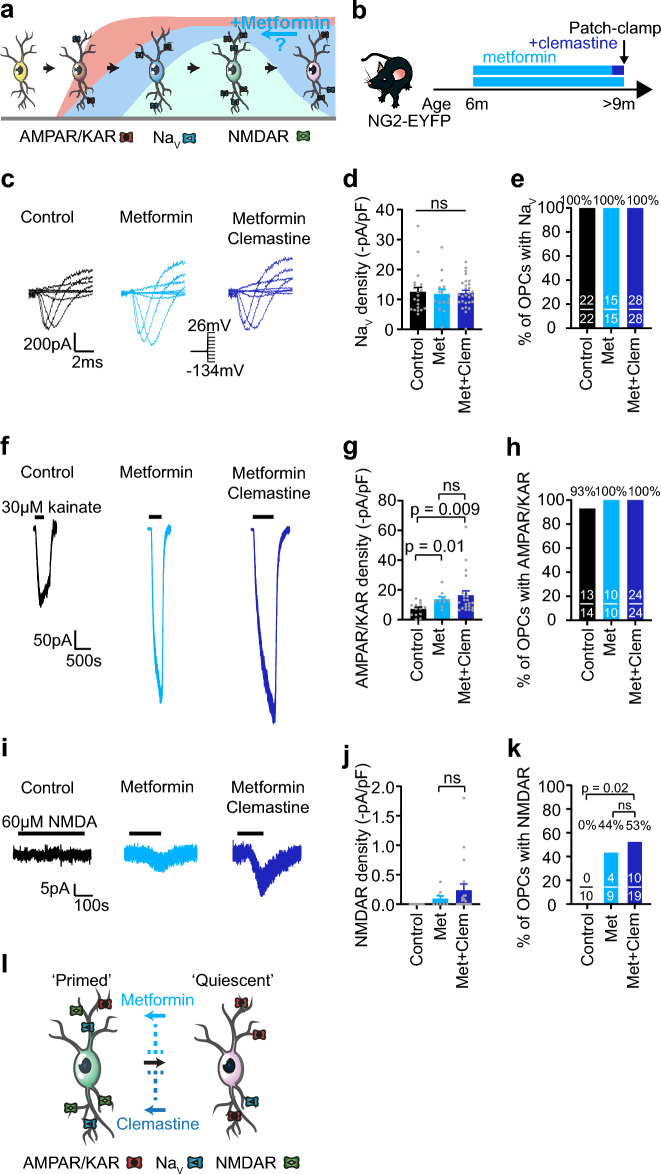
Figure 3.
Metformin administration prevents loss of NMDA receptors at 9 months. (a) OPCs acquire different voltage-gated ion channels and glutamate receptors with age, with at least five different electrophysiological profiles identified by Spitzer et al.13. The curves represent the proportion of OPCs with AMPARs/KARs (red), NaV (blue), and NMDARs (green) with age. Adapted from Spitzer et al., Neuron 201913 with permission, CC BY. (b) 6 m mice were given metformin in their drinking water for 3 months before patch-clamp recordings. A second group of mice was given clemastine in addition to metformin during the last 7–10 days before patch-clamp recordings. (c) Leak-subtracted traces of NaV currents in response to 20 mV steps from a holding potential of − 74 mV (inset, voltage steps from − 134 to + 26 mV) in cortical OPCs from control (black), metformin (light blue) and metformin + clemastine-treated (dark blue) > 9 m mice. (d) Metformin or metformin + clemastine treatment do not alter NaV density (p = 0.9, one-way ANOVA, control: n = 22, metformin: n = 15, metformin + clemastine: n = 28). (e) The proportion of OPCs with NaV was unaltered by metformin or metformin + clemastine treatment. (f) 30 µM kainate-evoked currents in cortical OPCs from control (black; also shown in Fig. 1g), metformin (light blue) and metformin + clemastine-treated (dark blue) > 9 m mice. (g) Metformin and metformin + clemastine administration increased AMPAR/KAR density in OPCs (p = 0.04, one-way ANOVA, control: n = 14, metformin: n = 10, metformin + clemastine: n = 22), but did not differ from each other. P values on the bar graph are from Holm–Bonferroni post-hoc tests. (h) The proportion of cells with AMPARs/KARs did not differ with metformin treatment. (i) 60 µM NMDA-evoked currents in cortical OPCs from control (black; also shown in Fig. 1j), metformin (light blue) and metformin + clemastine-treated (dark blue) > 9 m mice. Metformin and metformin + clemastine treatments lead to detectable NMDA currents in OPCs, in contrast to controls. (j) NMDA-evoked current density did not differ between metformin and metformin + clemastine treated-mice (p = 0.2, unpaired two-tailed t-test, metformin: n = 9, metformin + clemastine: n = 19). (k) Metformin and metformin + clemastine treatments increased the proportion of OPCs with detectable NMDAR currents from 0% in controls to 44% and 53% in metformin and metformin + clemastine, respectively. P values on the graph are from χ2 tests. (l) Clemastine and metformin extend the window of NMDAR surface expression by either reversing NMDAR loss or preventing NMDAR downregulation, likely reversing (full arrows) or preventing (dashed lines) the transition from an NMDAR-rich state, perhaps primed to differentiate13,16, to a quiescent state, lacking NMDAR receptors. Data are shown as mean ± SEM, with grey dots indicating individual recorded cells in (d,g,j). The numbers on the bars in (e,h,k) indicate the number of responding cells over the number of recorded cells.

