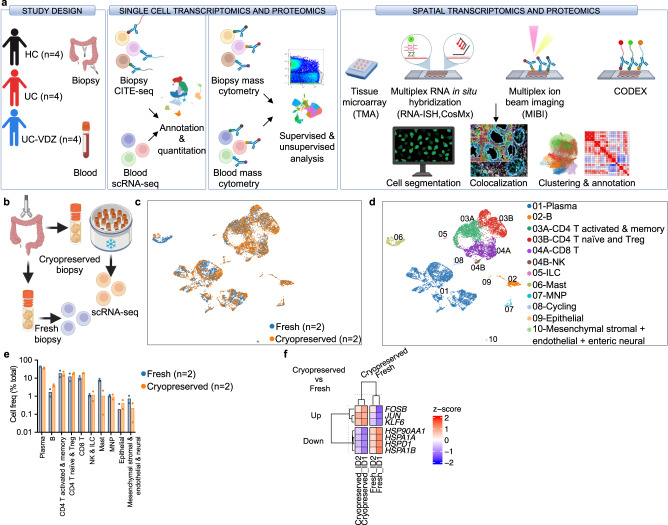
Fig. 1. Schematic of study design and fidelity of cryopreserved compared to fresh biopsy processing for scRNA-seq.
a Schematic of study design. Created with BioRender.com. b Schematic of Cryopreserved versus Fresh biopsy processing comparison. Created with BioRender.com. Representative UMAP visualization of 10,648 cells for two donors comparing (c) Cryopreserved versus Fresh biopsies and (d) coarse cell subset annotations. e Cell frequency as a percent of total for coarse cell subsets for two donors comparing Cryopreserved versus Fresh biopsies (mean; n=number of patients; each dot represents one patient sample; multiple Mann–Whitney tests with FDR correction; q < 0.1 threshold for discovery, only significant differences are indicated). f Heatmap of expression z-scores for differentially expressed (DE) genes with log2 fold-change (log2fc) > 0.4 or <−0.4 and Bonferroni p value < 0.1 comparing Cryopreserved (Up/Down) relative to Fresh biopsies for two study subjects ID1 and ID2 identified by MAST analysis. Only significant differences are shown. MNP mononuclear phagocyte: Treg-regulatory T cell, NK natural killer, ILC innate lymphoid cell.

