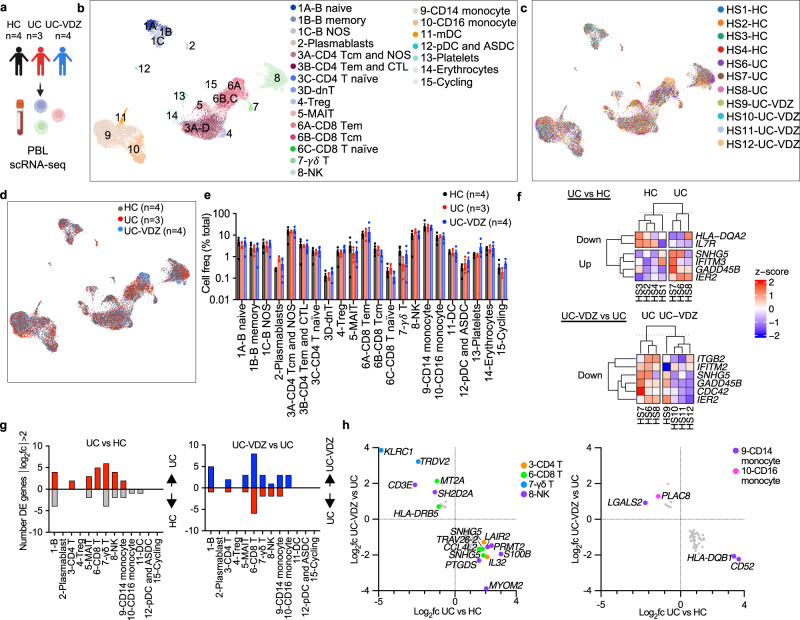
Fig. 2. scRNA-seq of peripheral blood leukocytes (PBLs) reveals correlation of VDZ with DE genes, but not circulating leukocyte subset frequency.
a Schematic of PBL scRNA-seq. Created with BioRender.com. UMAP visualization of pooled multiplex scRNA-seq for 20,130 PBLs from HC (n = 4), UC (n = 3), and UC-VDZ (n = 4) patients highlighting (b) fine cell annotations, (c) patient identity, and (d) disease and treatment status. e, Cell frequency as a percent of total cells per study subject stratified by disease and treatment status (mean ± SEM; n = number of patients; each dot represents one patient sample; multiple one-way ANOVA Kruskal-Wallis test with FDR correction; q < 0.1 threshold for discovery, only significant differences are indicated). f Heatmap of expression z-scores for scRNA-seq DE genes for all PBLs with log2fc > 1 or <-1 and Bonferroni-corrected p value < 0.1 comparing UC (Up/Down) relative to HC, and UC-VDZ (Up/Down) relative to UC identified by MAST analysis. g Number of scRNA-seq DE genes in the indicated PBL subsets with log2fc > 2 or <-2 in UC relative to HC and UC-VDZ relative to UC identified by MAST analysis. h scRNA-seq DE genes in the indicated PBL subsets with log2fc > 1.5 or <-1 in UC versus HC, and an inverse log2fc for UC-VDZ versus UC log2fc <−0.5 or >0.5, respectively identified by MAST analysis. For (f, h), ribosomal and mitochondrial genes are not displayed. NOS-not otherwise specified; mDC-myeloid dendritic cell; ASDC-AXL+ SIGLEC6+ myeloid DC pDC-plasmacytoid DC, MAIT mucosal-associated invariant T.

