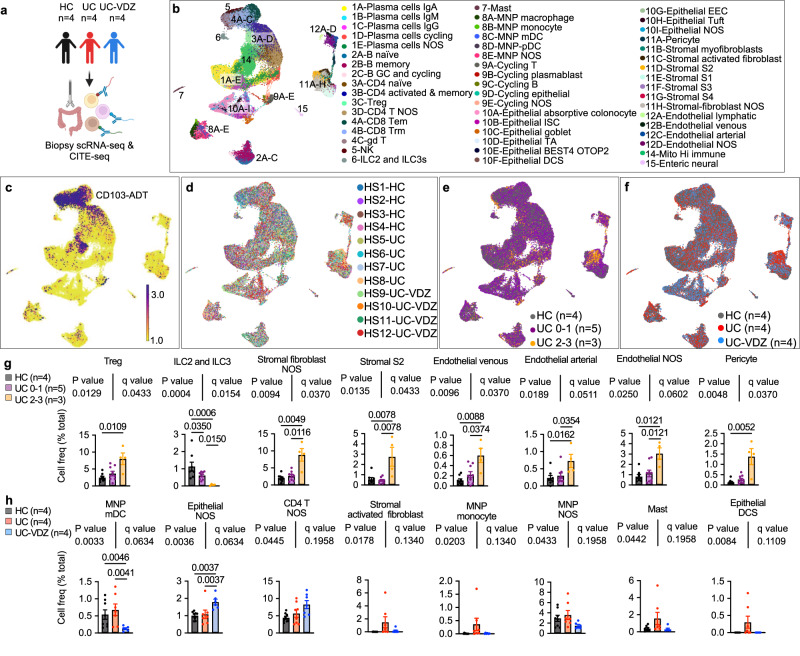
Fig. 3. scRNA-seq and CITE-seq of mucosal biopsies highlighted multiple immune and non-immune subsets correlating with inflammatory severity, disease status, and VDZ treatment.
a, Schematic of scRNA-seq and CITE-seq of mucosal biopsies. Created with BioRender.com. b-f, UMAP visualization of 93,900 cells from HC (n = 4), UC (n = 4), and UC-VDZ (n = 4) patients highlighting (b) fine cell subset annotations (c) representative CITE-seq CD103 antibody-derived tag (ADT), (d) patient identity, (e) endoscopic severity scores, and (f) disease and treatment status. Cell frequency for the indicated fine cell subset, expressed as a percent of total cells per study subject, stratified by (g) endoscopic severity and (h) disease and treatment status (mean ± SEM; n = number of patients; each dot represents one biopsy location, up to two locations were biopsied per patient; multiple one-way ANOVA Kruskal-Wallis tests with FDR correction; q < 0.1 threshold for discovery; select subsets are shown with exact p-value and q-value; individual inter-column q-values are displayed only for cell subsets with overall q < 0.1, an additional nested one-way ANOVA test was performed treating biopsies as replicates, with unadjusted p < 0.05 as an additional threshold for discovery). NOS not otherwise specified.

