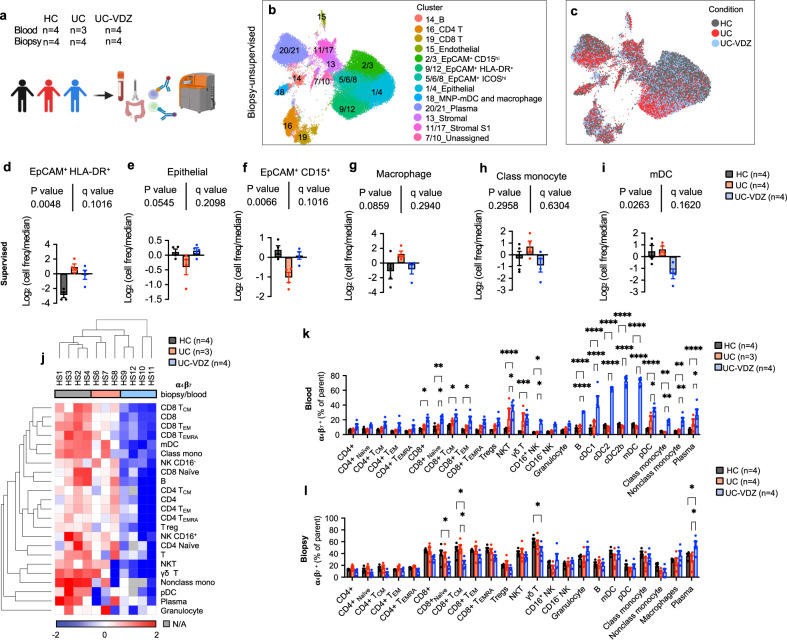
Fig. 4. Unsupervised and supervised CyTOF analysis identifies significant increase in circulating α4β7+ DCs in UC-VDZ patients.
a Schematic of CyTOF on blood and biopsy samples. Created with BioRender.com. UMAP visualization of the indicated samples (60,000 out of 684,249 live cell events displayed for biopsies) highlighting (b) annotated clusters, and (c) disease and treatment status. d–i Cell frequency of the indicated supervised subset analysis among conditions in biopsies expressed as log2 (cell freq/median) (mean ± SEM; n=number of patients; each dot represents one patient sample; multiple one-way ANOVA Kruskal-Wallis test with FDR correction; q < 0.1 threshold for discovery; individual inter-column q-values are displayed only for cell subsets with overall FDR corrected q < 0.1); the legend for (d–i) is shown in (i). j Heatmap of biopsy/blood ratio of α4β7+ cells for each cell subset by patient (hierarchically clustered by Euclidian distance, average linkage). k, l Percentage of α4β7 + cells in each defined cell subset per condition for blood and biopsy samples, respectively (mean ± SEM; n=number of patients; each dot represents one patient sample; two-way ANOVA comparing HC vs UC-VDZ and UC vs UC-VDZ with FDR correction; q < 0.1 threshold for discovery; *q < 0.05; **q < 0.01; ***q < 0.001; and ****q < 0.0001 (exact q-value are reported in Source Data); only significant differences are indicated). Class mono-classical monocyte; Nonclass mono-nonclassical monocyte; mDC-cDC1,cDC2,cDC2b; N/A-Not Applicable.

