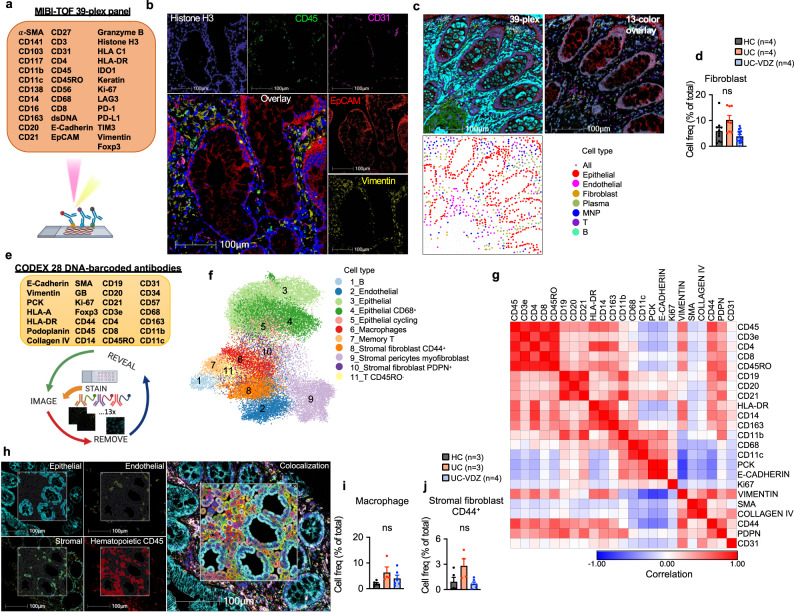
Fig. 5. MIBI and CODEX spatial proteomics using FFPE tissue identifies distinct phenotypes in mucosal biopsies of UC-VDZ patients.
a Schematic of MIBI workflow and customized antibody panel. Created with BioRender.com. MIBI images representative of 32 FOVs for (b) nuclear DNA, indicated major cell lineage markers, and 5 color overlay, and (c) 39-plex overlay, selected channels, and related spatial scatter plots for coarse annotation of the indicated cell subsets. d Cell frequency as a percent of total cells detected by MIBI for the indicated cell subset. e Schematic of CODEX workflow and antibody panel. Created with BioRender.com. f UMAP visualization of 68,804 captured cells (50,000 cells displayed) highlighting annotated clusters. g Marker similarity matrix among 23 selected markers (Pearson correlation). h CODEX images representative of 15 cores, phenotype identification highlighting indicated markers and major phenotype colocalization. i, j Cell frequency as a percent of total cells detected by CODEX for the indicated cell subsets. For panels (d),(i),(j), mean ± SEM; n=number of patients; each dot represents one FOV for MIBI or one core for CODEX; multiple one-way ANOVA Kruskal-Wallis test with FDR correction; q < 0.1 threshold for discovery; ns not significant.

