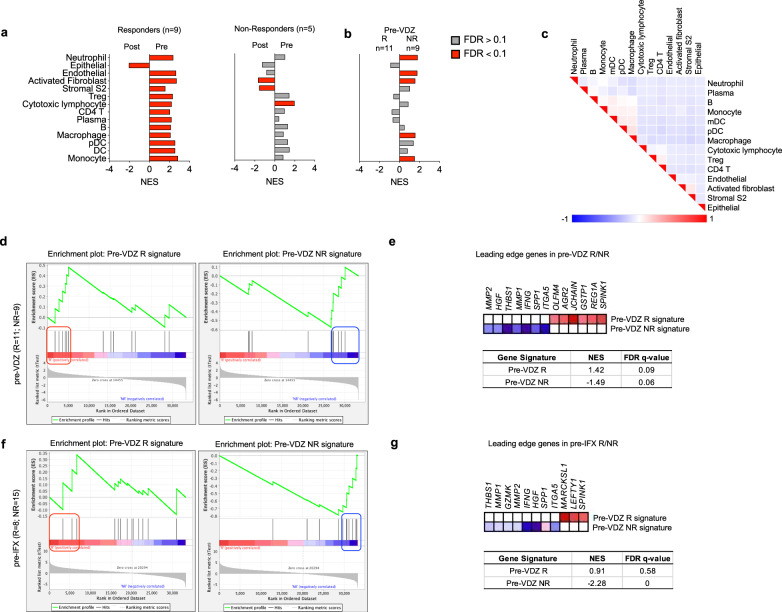
Fig. 8. Gene set enrichment analysis (GSEA) of an external, publicly-available, bulk transcriptomic dataset (GSE73661) using cell subset and spatial transcriptomic signatures associated with response and non-response to VDZ.
Normalized Enrichment Scores (NES) in bulk tissue transcriptomic data comparing (a) pre- and post-treatment samples for VDZ responders (R) and non-responders (NR), (b) pre-VDZ R vs NR (red bars FDR < 0.1, gray bars FDR > 0.1). c Leading edge analysis of significantly enriched gene sets. d–g, GSEA of VDZ response and non-response spatial signatures in external cohort of patients (d) pre-VDZ and (f) pre-IFX. Subset of genes comprising the leading edge of the NES and FDR q-values in (e) pre-VDZ and (g) pre-IFX patients, respectively. IFX infliximab.

