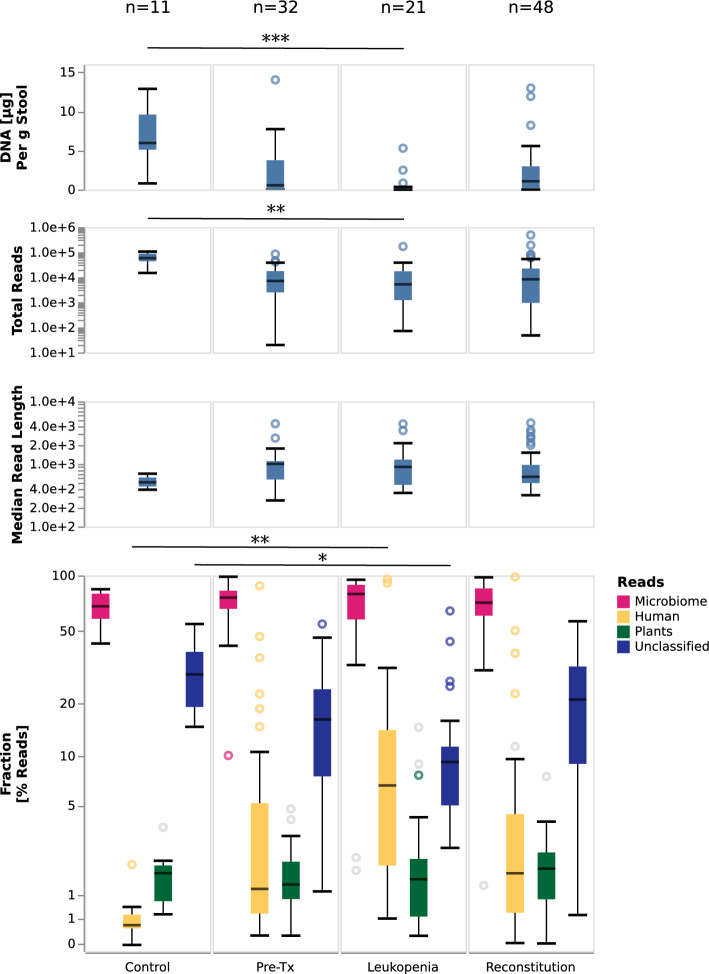
Figure 2.
DNA amounts, sequencing metadata, and high-level stool sample compositions. Shown are the amounts of extracted DNA per gram of stool; the number of generated Nanopore sequencing reads; median read lengths; and the relative proportions of microbial-, human-, and plant-assigned reads, as well as the proportions of reads remaining unclassified by the initial Kraken2-based step. Gray circles in the bottom panel indicate outliers for which less than 80% of the reads are in taxa validated by the mapping-based validation step. For each panel, the most significant difference between included categories is indicated (Mann–Whitney U test; * [p < 1.19 × 10⁻³], ** [p < 2.38 × 10⁻⁴] or *** [p < 2.38 × 10⁻⁵]). Raw data is shown in Supplementary Table 3 and Supplementary Table 4.

