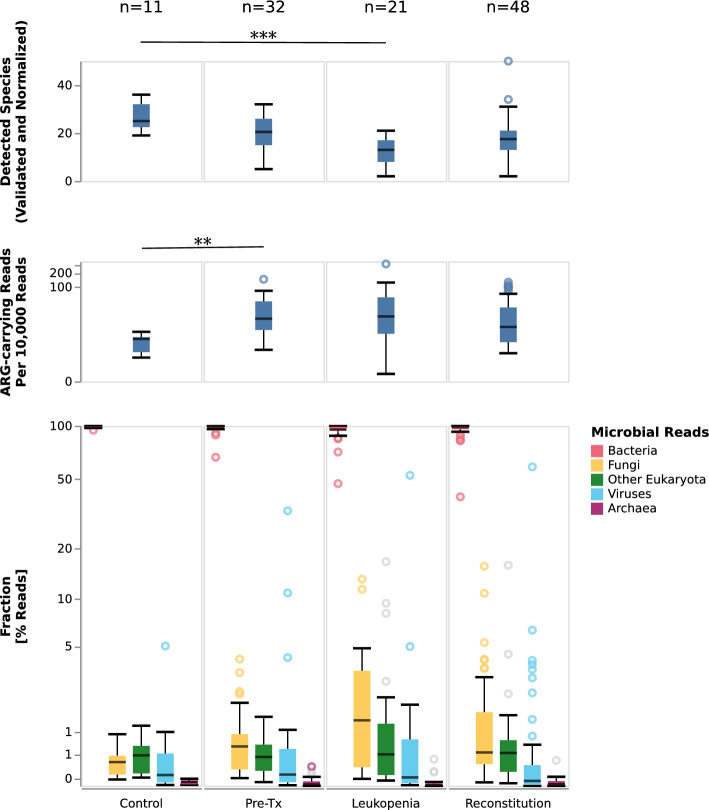
Figure 3.
Diversity, ARG-carrying reads, and microbiome composition in stool samples from controls and alloHSCT patients at indicated phases. Shown are the numbers of detected genera, normalized to the sample with the lowest read count; the rate of reads that carry an ARG element; and the relative proportions of bacterial-, fungal-, archaeal-assigned reads as well as the proportion of reads assigned to DNA viruses (incl. bacteriophages), and non-fungal eukaryotes. Gray circles in the bottom panel indicate outliers for which less than 80% of the reads are in taxa validated by the mapping-based validation step. For each panel, the most significant difference between included categories is indicated (Mann–Whitney U test; * [p < 1.19 × 10⁻³], ** [p < 2.38 × 10⁻⁴] or *** [p < 2.38 × 10⁻⁵]). Raw data is shown in Supplementary Table 3 and Supplementary Table 4.

