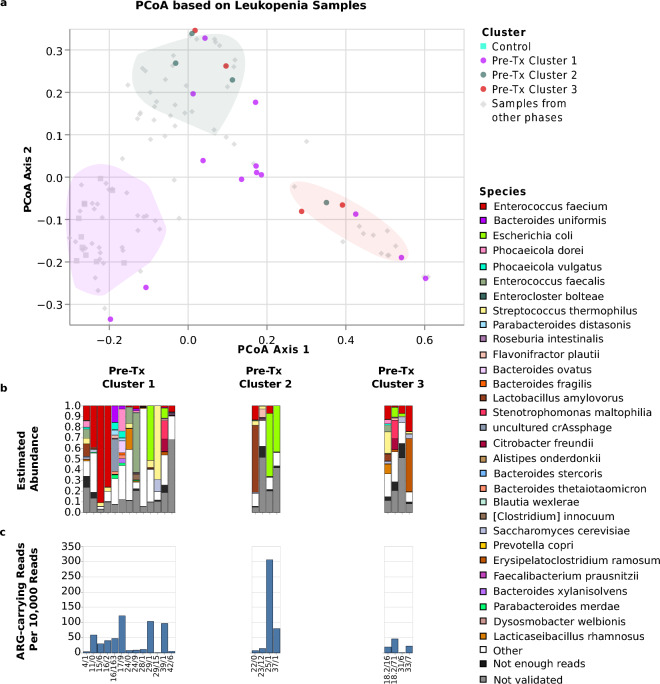
Figure 5.
Microbiome structures and compositions during leukopenia. The Figure shows, for alloHSCT samples collected during the leukopenic period, (a) sample positions in the joint PCoA space of all samples, (b) bar plots visualizing sample microbiome compositions, and (c) rates of reads carrying an ARG element. All visualizations are stratified by pre-Tx cluster membership of the corresponding patients; in the top panel, pre-Tx cluster membership is indicated by dot color. The bar plots show the 30 species that attained the highest mean frequency across all time points, and, of these, within each sample, only the species that 1.) were assigned at least 5 reads and 2.) passed the mapping-based taxon validation step were depicted. The combined abundance of species with fewer than 5 reads is shown in the category “Not enough reads”; the category “Not validated” shows the combined abundance of species with more than 5 Kraken2-assigned reads that did not pass the mapping-based validation step. Sample labels below the bar plots specify patient ID, followed by the day of sampling relative to the stem cell transplantation time point.

