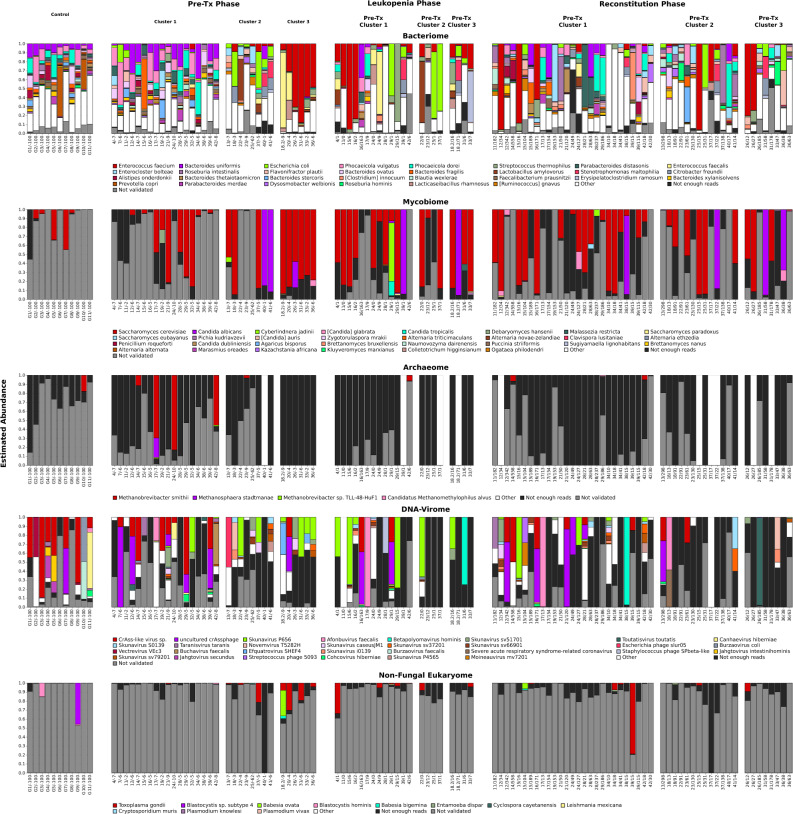
Figure 7.
Integrated microbiome analysis of all characterized samples. Shown are, for each sample, bar plots that visualize the respective compositions of the bacterial, fungal, archaeal, DNA-viral, and non-fungal eukaryotic components of the sample microbiome. Normalization was applied independently to each bar plot. The bar plots only show the 30 (for bacteria, fungi and DNA viruses), 4 (for archaea), and 11 (for non-fungal eukaryotes) species that attained the highest mean relative frequency within the considered taxonomic category across all timepoints, and, of these, within each sample, only the species that (a) were assigned at least 5 reads by Kraken2, and (b) passed the mapping-based taxon validation step. The combined abundance of species within each taxonomic category with fewer than 5 reads is shown in the category “not enough reads”; the category “not validated” shows the combined abundance of species with more than 5 reads that did not pass the mapping-based validation step. Sample labels below the bar plots specify healthy control ID or the patient ID, followed by the day of sampling relative to the transplantation event.

