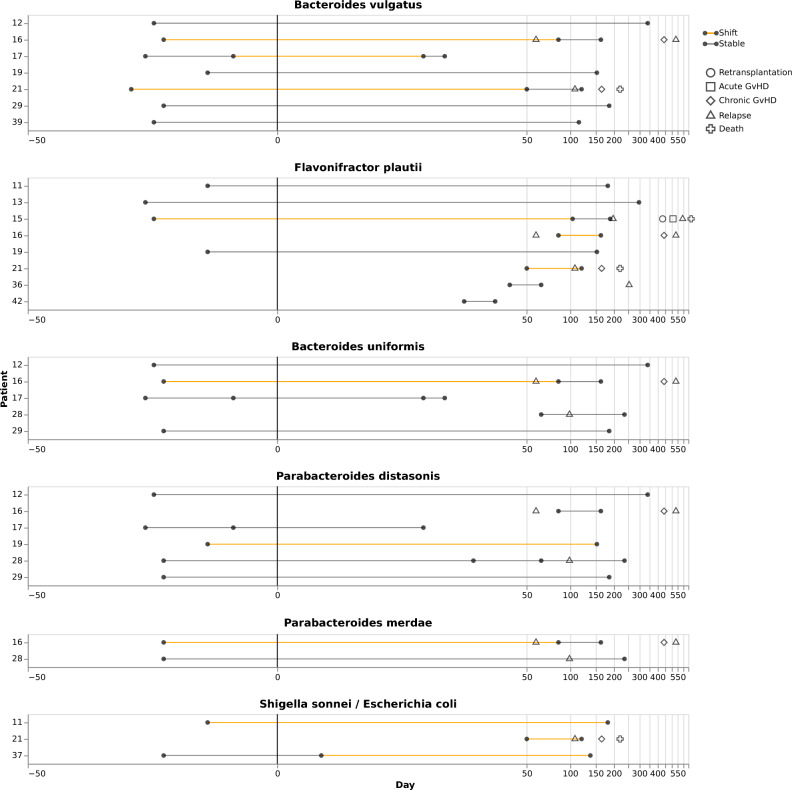
Figure 8.
Strain replacement analysis. The Figure visualizes strain dynamics for combinations of bacterial species and sampling timepoints for which sufficient Illumina short-read data was available. Each species is represented by a main panel; main panels are labeled with patient IDs on the y-axis and sampling times on the x-axis. Each dot represents one sampling event, and each horizontal line represents the period between two sampling events. Horizontal lines are colored according to whether a strain replacement event was determined to have taken place between the two sampling events (orange) enclosing the line. Additional symbols indicate adverse events.

