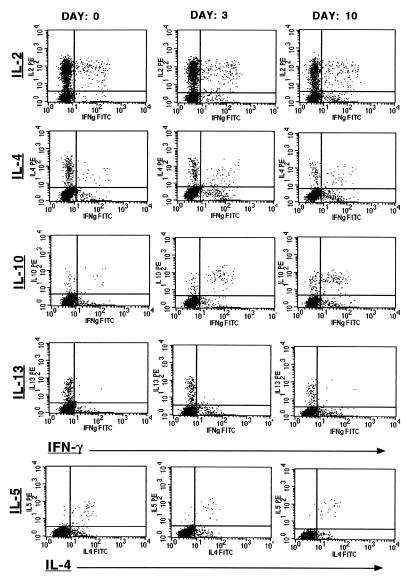
FIG. 2.
Representative two-parameter dot plots displaying the kinetics of the frequency of cytokine-producing CD4+ cells during the course of antimalarial treatment. Each vertical row depicts the results of the cytometric analyses performed for one representative patient before treatment (day 0), during clearance of parasites (day 3), and after resolution of parasitemia (day 10). IFN-γ (IFNg; x axis) was stained in combination with IL-2, IL-4, IL-10, and IL-13 (all y axis). IL-4 (x axis) was also combined with IL-5 (y axis). The quadrant statistics were set on the basis of the corresponding negative controls. Corresponding data and statistics are displayed in Fig. 3 and its legend.

