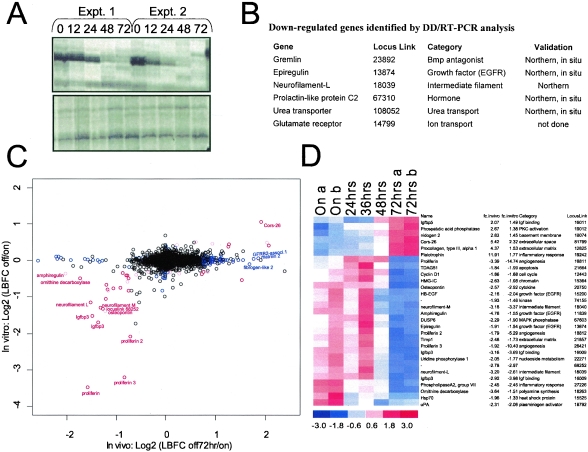
FIG. 2.
Profiling the H-RASV12G-dependent expression program. (A) Representative DD/RT-PCR analyses of melanomas at successive intervals following doxycycline withdrawal. Upper panel, identification of a down-regulated RT-PCR product. Lower panel, RT-PCR products unchanged during tumor regression. The DD/RT-PCR method uses arbitrary primers to profile expression of numerous mRNAs simultaneously (37). Expt., experiment. (B) Down-regulated genes identified by DD/RT-PCR. (C) Graph comparing genes significantly regulated by H-RASV12G in vivo (x axis) and in vitro (y axis) as determined by microarray analysis (see Materials and Methods). Genes in red are significantly modulated both in vivo and in vitro. Genes in blue are regulated only in vivo. The black circles represent genes without significant expression changes. (D) Genes with alterations in expression in both the in vivo and in vitro data sets. Blue color in 72 h specimens represents decreased expression following doxycycline withdrawal, while red color represents increased expression. The standardized expression values (mean of 0 and standard deviation of 1) for each gene is displayed in a range of from −3 to 3. Expression profiling analysis of two tumors is shown for the On and 72-h time points.

