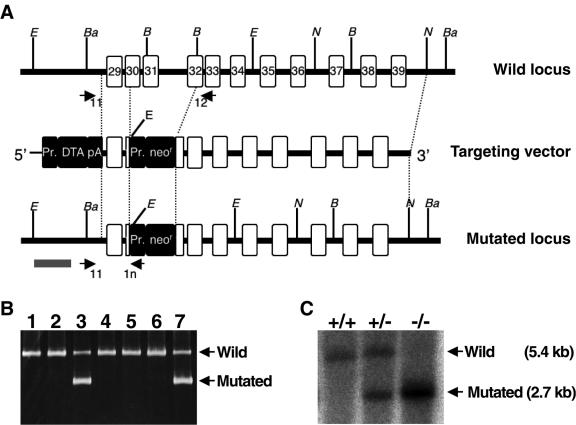
FIG. 4.
Generation of Abca5−/− mice. (A) Schematic illustrations of the targeting strategy. Exons are shown as white boxes with exon numbers based on alignment of the NM_147219 and mouse genomic DNA sequences. The italic letters B, Ba, E, and N represent the restriction enzyme sites of BglII, BamHI, EcoRI, and NcoI, respectively. Closed boxes indicate the inserted gene cassettes [Pr, promoter; DTA, subunit A of the diphtheria toxin gene; pA, PGK (phosphoglycerate kinase-1) poly(A) signal; neor, neomycin resistance gene]. Arrows indicate the three primers, 11, 12, and 1n, that were designed for PCR screening. The gray bar represents the probe region for genomic Southern blot analysis. (B) PCR screening of ES cells. Arrows indicate the 1.9-kb and 0.85-kb PCR products derived from the wild-type mABCA5 and the mutated loci, respectively. (C) Genotyping by genomic Southern blot analysis. Genomic DNAs were digested with EcoRI, followed by detection with a [α-32P] dCTP-labeled DNA probe (gray bar in panel A). Arrows indicate the 5.4- and 2.7-kb bands derived from the wild-type and mutated loci, respectively.

