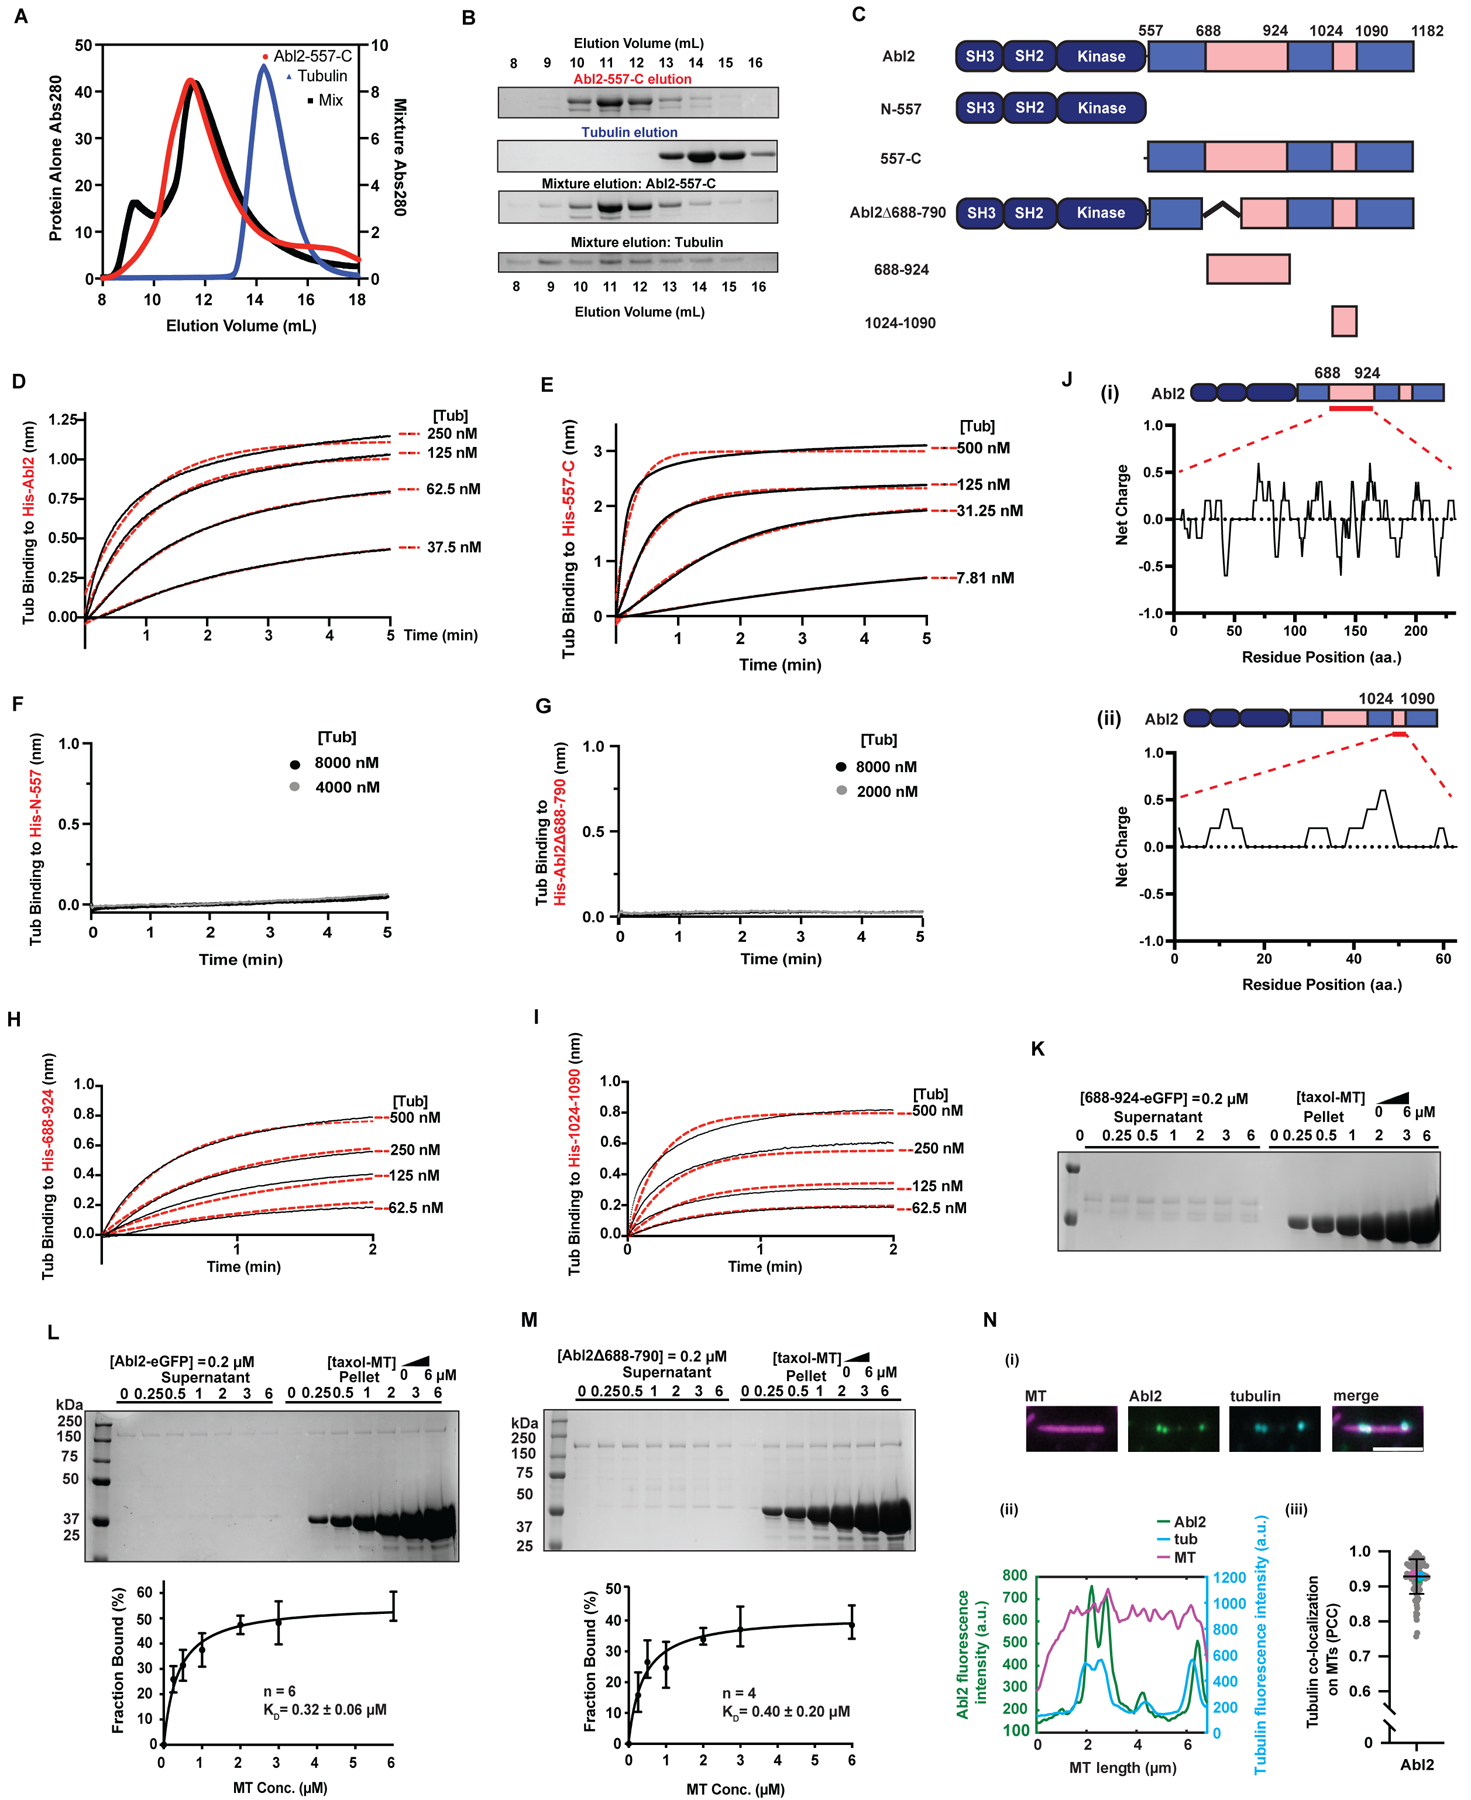
Figure 1. Abl2 binds tubulin via two regions in the C-terminal half.

(A) SEC analysis of 557-C alone (left Y axis, red line), tubulin alone (left Y axis, blue line), and the mixture (right Y axis, black line) with (B) showing the corresponding SDS-PAGE analysis of the elution fractions. Tubulin alone was eluted at fractions 13–15 ml and was shifted to fractions 8–15 ml in the presence of 557-C. (C) Domain architecture of Abl2, Abl2-74-557 (N-557), Abl2-557-1182 (557-C), Abl2Δ688-790, Abl2-688-924, and Abl2-1024-1090. (D) 6XHis-Abl2, (E) 6XHis-557-C, (F) 6XHis-N-557, (G) 6XHis-Abl2Δ688-790, (H) 6XHis-688-924, or (I) 6XHis-1024-1090 were immobilized on a Ni-NTA biosensor and the association of tubulin at different concentrations was measured. Representative traces are shown, with data shown in black and global exponential fits in red dotted lines. Full concentration series (4 tubulin concentrations) were performed three independent times and used to calculate KD, as summarized in Figure S1K. (J) Net charges of every 5-residue block within Abl2-688-924 (i) and Abl2-1024-1090 (ii). The residue charge distribution was calculated with EMBOSS to indicate positively-charged clusters. (K-M) Representative gels of the MT co-sedimentation assays performed with 688-924-eGFP (K), Abl2-eGFP (L), and Abl2-Δ688-790-eGFP in (M) are shown. Plots of percentages of Abl2-eGFP or Abl2Δ688-790 bound versus MT concentration are shown in the bottom panels with best fit KD values shown. The number of experimental replicates is indicated by n. Data are mean ± SD. See also Figure S1J, S1L. (N) Abl2 co-localizes with tubulin dimers on GMPCPP-MTs. (i) Representative Abl2- and tubulin-bound MT. (ii) Quantification of fluorescence intensities of Abl2-eGFP and Alexa647-tubulin on the rhodamine-labeled GMPCPP-MT shown in (i). (iii) Pearson-correlation coefficient (PCC) analysis reveals that Abl2 and tubulin co-localize on a MT. Magenta, cyan, and green points indicate the mean PCC for each technical replicate. n = 94 filaments across 3 technical replicates. See also Figure S1.
