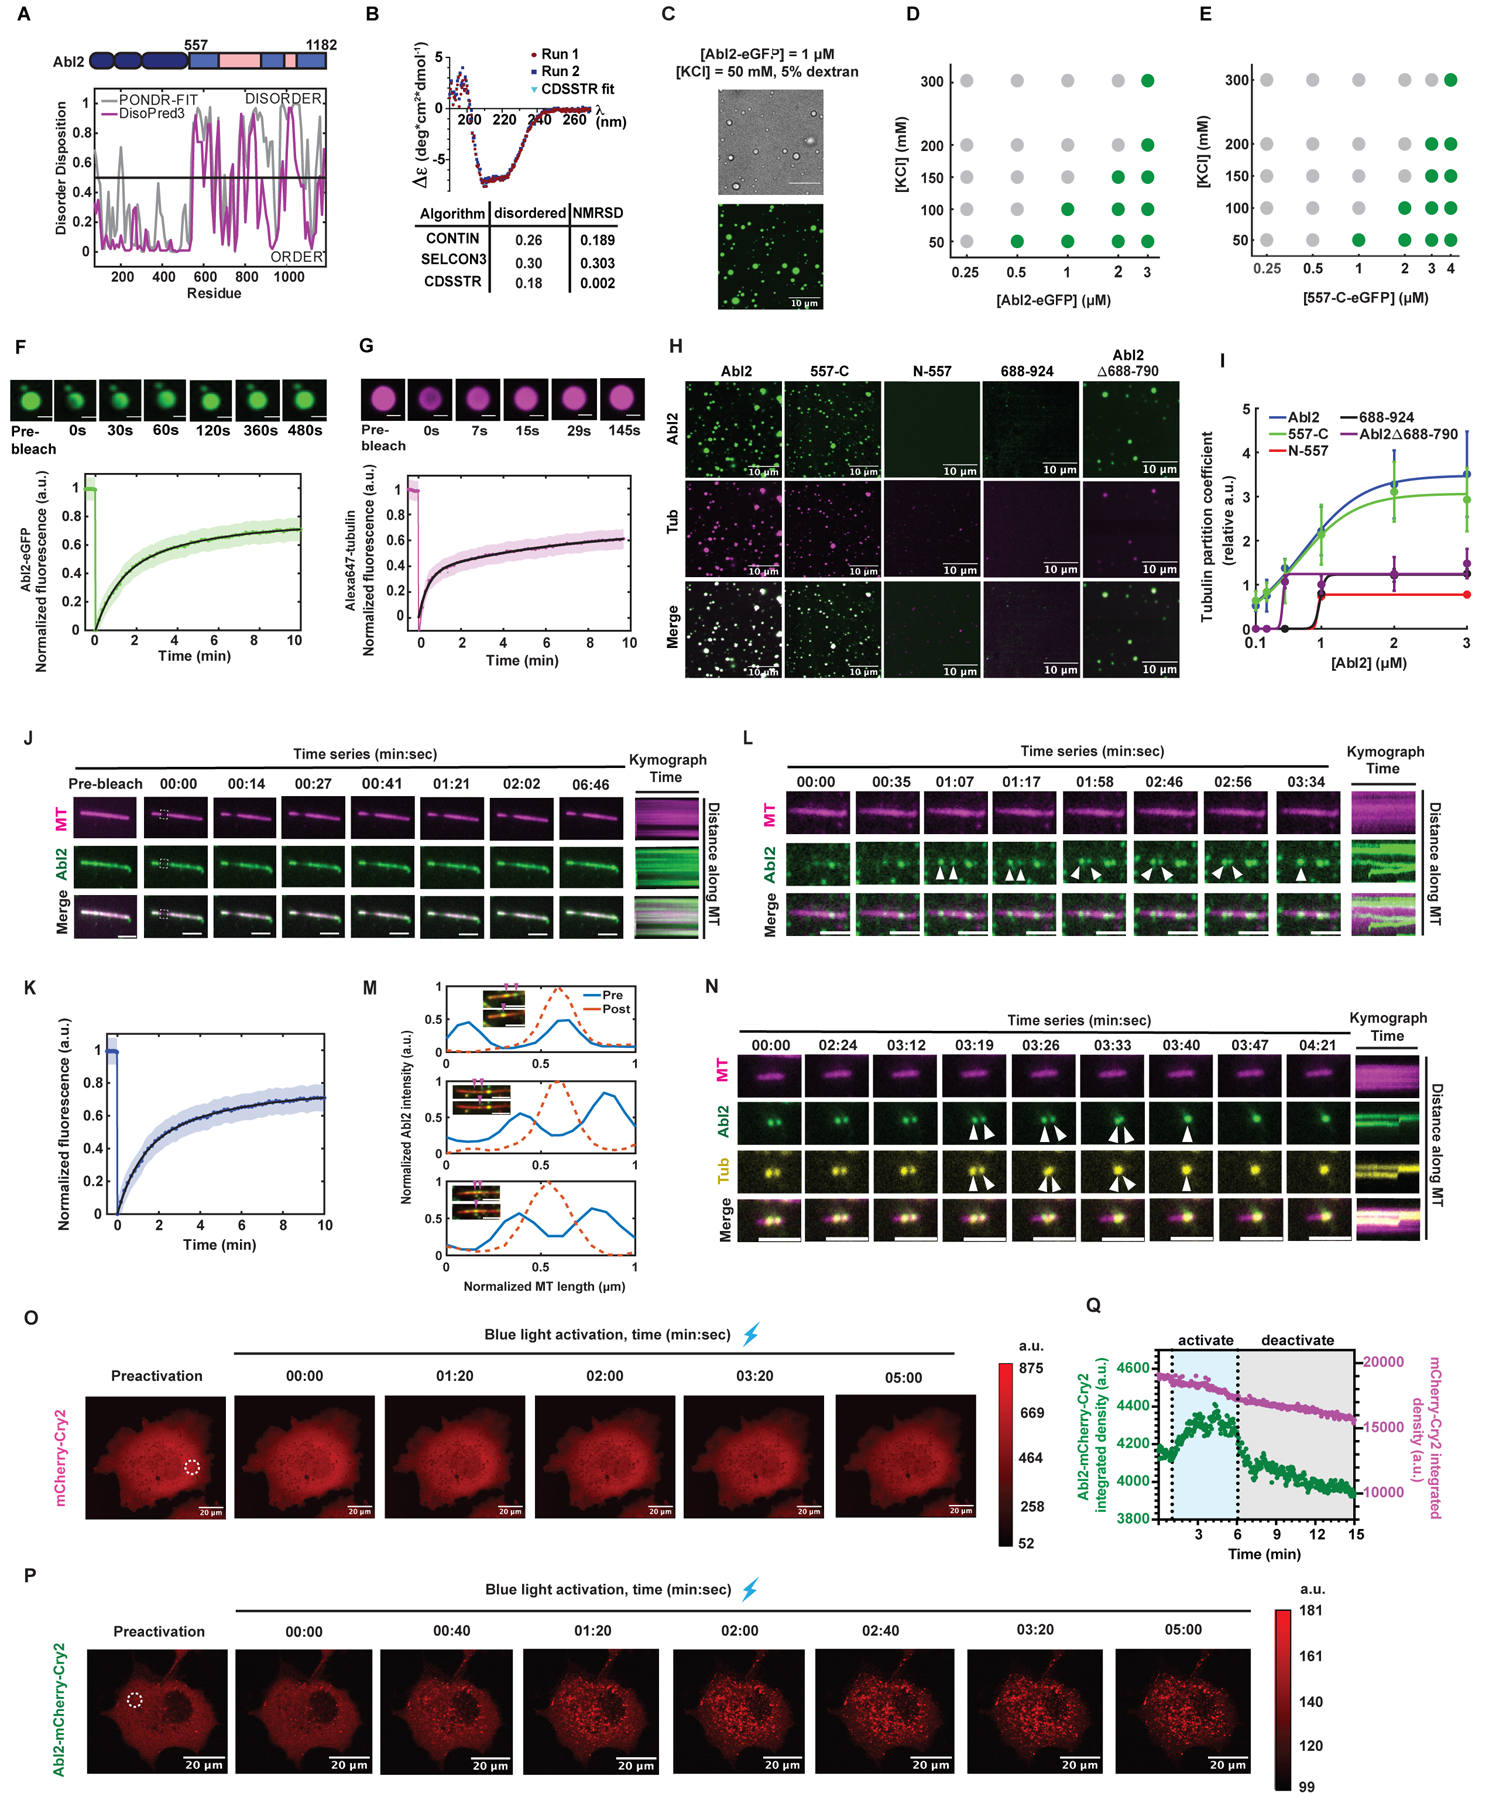
Figure 2. Abl2 undergoes phase separation and co-condenses with tubulin.

(A) Disorder prediction from primary sequence of murine Abl2 using PONDR-FIT and DisoPred3 algorithms. Disorder disposition of 0.5 was used as the threshold. (B) Buffer-subtracted CD spectra of 6XHis-tag free 557-C collected at 4°C. CD spectra deconvolution algorithms CONTIN, SELCON3, CDSSTR analyses reveal the disordered content of the 557-C. n = 2. (C) 1 μM Abl2-eGFP forms condensates in 5% dextran, 50 mM KCl, and BRB80. Condensates were imaged under brightfield (top) and fluorescence (bottom). Scale bar, 10 μm. Phase separation diagrams of the [Abl2-eGFP] vs. [KCl] (D) and [557-C-eGFP] vs. [KCl] (E) relationships. Partition coefficient (PC) ≥ 4 was the threshold for phase separation, shown as green dots, PC < 4 is defined as not phase separated, shown as gray dots. X-axis shown on log10 scale. 17–230 condensates were analyzed per condition. (F,G) FRAP recovery of Abl2-eGFP in condensates (F) and tubulin in Abl2-eGFP:Alexa647-tubulin co-condensates (G) in solution. Double-exponential fits shown in solid black with SEM shown as green. n ≥ 11 condensates. Scale bar, 2 μm in (F); 1 μm in (G). (H) 1 μM Abl2, 557-C, N-557, 688–924, and Abl2Δ688-790 were incubated with equimolar concentrations of Alexa647-tubulin in BRB80, 5% dextran, 50 mM KCl to test for co-condensation. (I) PC analysis of co-condensed tubulin in Abl2 condensates at increasing equimolar concentrations of Abl2-eGFP and tubulin at 50 mM KCl. At least 90 tubulin co-condensates were scored for Abl2, 557-C, and Abl2Δ688-790. N557: n2μM = 37; n3μM = 89; 688–924: n2μM = 53; n3μM = 147. Sigmoidal fits shown in solid lines. Data are mean ± SD. (J, K) Representative time series of FRAP on Abl2 puncta on GMPCPP-stabilized MTs (J). Bleached ROI shown in dashed white line. Scale bar, 3 μm. FRAP recovery curve reveals that Abl2 condensates are undergoing dynamic exchange with other molecules on the MT and/or from solution (K). Double-exponential fit in solid black with SEM shown as blue. n = 15 filaments. (L, M) Representative time series of fusion of Abl2 condensates (L, scale bar = 3 μm) or Abl2-tubulin co-condensates (M, scale bar = 5 μm) on a rhodamine GMPCPP-MT (pseudo-colored magenta). Kymographs are shown on right. (N) Fluorescence intensity analysis of fusion events of Abl2-eGFP puncta on stabilized MTs, as shown in (M). Post-fusion condensates yield higher mean fluorescence intensities (dashed orange line) relative to their pre-fusion condensates of various sizes (solid blue lines). (O,P) Representative time series of mCherry-Cry2 (O) and Abl2-mCherry-Cry2 (P) in transfected COS-7 cells, shown pre- and post-blue light activation (λ = 488 nm). Raw fluorescence intensity color bars shown on right. (Q) Quantification of mCherry intensity (integrated densities, a.u.) within the ROIs shown in (O, magenta) and (P, green) indicated by dashed white circles. Blue shaded region depicts 5 min blue light activation period. Gray shaded region depicts 10 min following blue light exposure. See also Figure S2.
