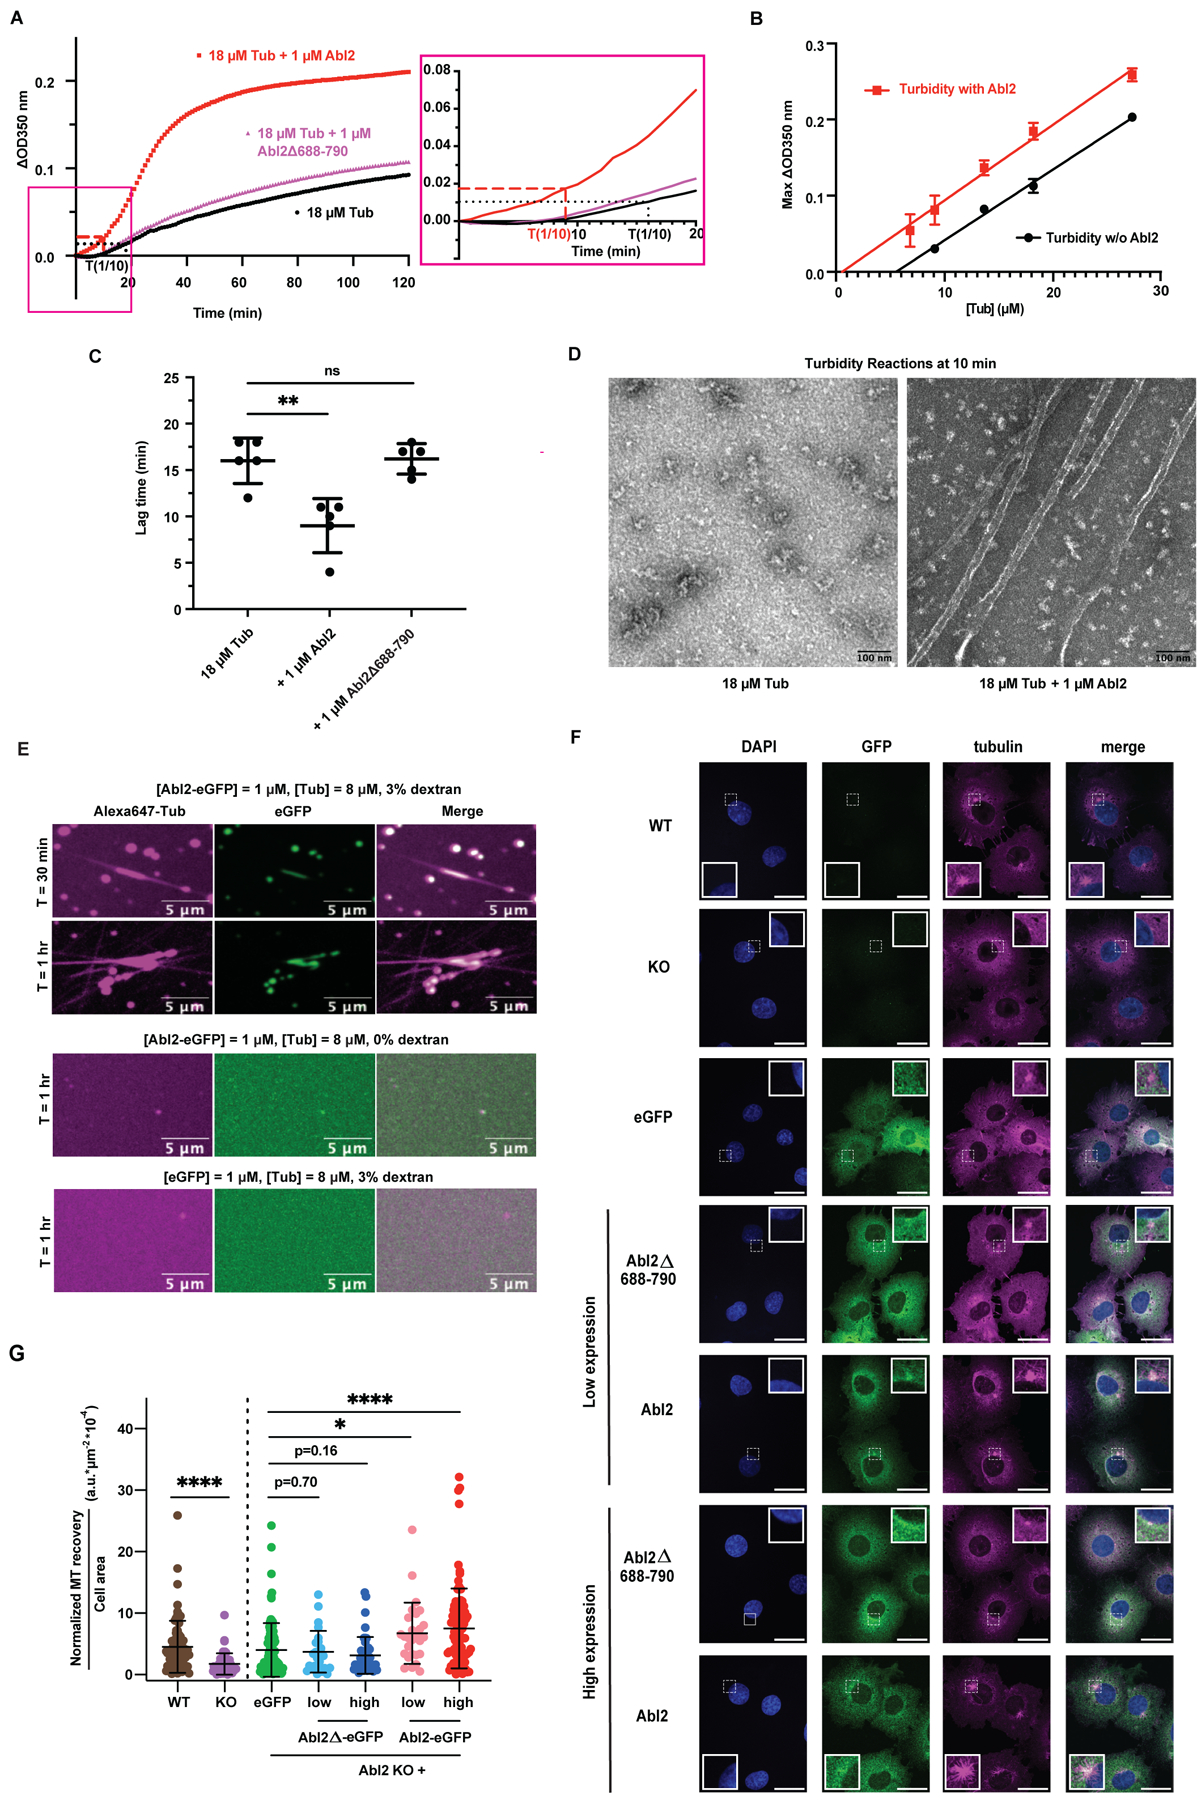
Figure 3. Abl2 promotes MT nucleation via interactions with tubulin and MTs.

(A) MT assembly was monitored by measuring the increase in turbidity (ΔOD350). 18 μM tubulin and 2 mM GTP were incubated alone (black) or with 1 μM Abl2 (red) or Abl2Δ688-790 (magenta). Representative time series of OD350 measurements are shown. Curves in the blue dotted window were expanded in the right panel. Lag time of reactions with (red) and without Abl2 (black) are indicated with the dotted line. (B) Turbidity assays with different tubulin concentrations were performed and the maximal ΔOD350 was plotted against initial tubulin concentration to determine the critical concentration of tubulin polymerization. n = 3 replicates at each concentration for each of these experiments. (C) The lag time until ΔOD350 reaches 1/10 of the maximal ΔOD350 was measured. The inclusion of Abl2 significantly decreased the lag time for MT nucleation. Mann-Whitney test. n = 5. **, p < 0.001. (D) Representative samples taken 10 min after turbidity reactions were initiated were visualized under negative-stain EM. More polymerized MT segments were observed in the presence of Abl2. (E) Representative confocal images of the MT nucleation from the Abl2-eGFP:Alexa647-tubulin co-condensates under 3% dextran. Control reactions containing Abl2-eGFP and Alexa647-tubulin without dextran, or mixing eGFP and Alexa647-tubulin with 3% dextran did not show observable MTs growing after 1 hr. (F) WT COS-7, Abl2 KO COS-7, and eGFP-, Abl2Δ688-790-eGFP-, and Abl2-eGFP-expressing Abl2 KO cells were treated with 10 μM nocodazole for 1 hr, at which time nocodazole was removed and replaced with complete medium. Immunofluorescence images of cells upon 5 min after washout for quantification of MT reassembly from the microtubule organizing center (white dashed inlets with expanded views in solid white borders) shown. Scale bar, 25 μm. (G) The integrated fluorescence intensity of recovered MTs was measured and normalized to the total cell area. MT recovery values for each condition was normalized to the average MT recovery of WT cells per experimental replicate. Welch’s t-test. n ≥ 25 cells analyzed across 2–3 experimental replicates. Data are mean ± SD. *, p < 0.05; ****, p < 0.0001. See also Figure S3.
