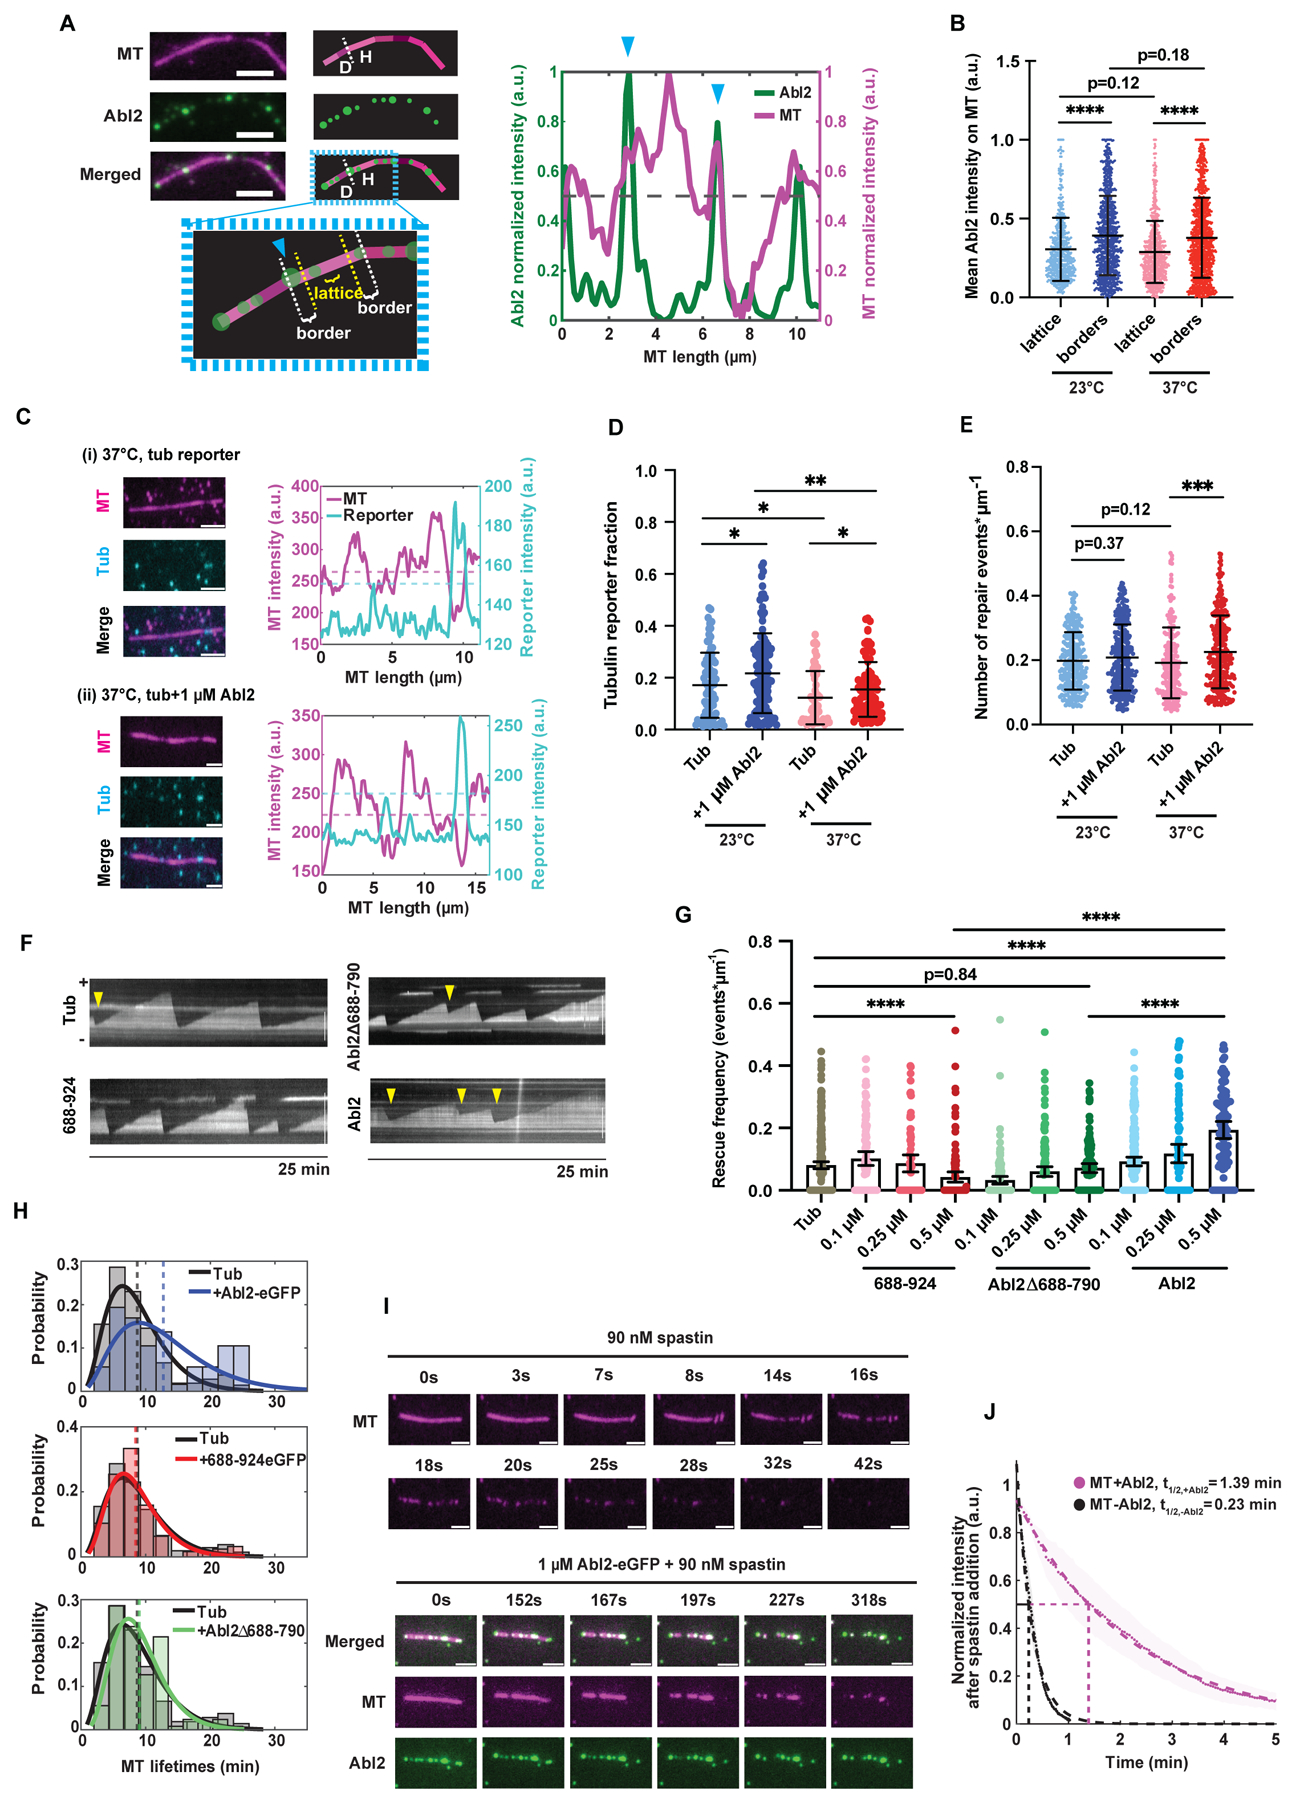
Figure 5. Abl2 promotes damaged lattice repair and increases MT lifetime.

(A) Left: Representative Abl2-eGFP localization on a 37°C-overnight stored taxol-stabilized MT. Borders were defined as boundaries on ‘healthy’ (“H”) structurally intact MT segments adjacent to ‘damaged’ (“D”) segments, demarcated with a blue arrow. Lattices were stretches that are ≥ 1/5 of the total MT segment length away from either terminus. Scale bar, 3 μm. Right: Quantification of MT and Abl2-eGFP intensities along the taxol-stabilized MT shown on left. Dotted black line denotes the mean normalized MT fluorescence intensity, which was used as the threshold for scoring a segment as “H” or “D”. Normalized fluorescence intensity scale bar shown on left. (B) Mean intensities of 1 μM Abl2-eGFP at borders and lattices of healthy MT segments along filaments stored at 23°C and 37°C overnight. Means shown as solid horizontal black lines, 25–75% quartiles shown as box plots. n ≥ 600 healthy segments analyzed per condition. Wilcoxon rank sum test. ****, p < 0.0001. (C) Representative taxol-stabilized rhodamine-MTs stored at 37°C overnight (magenta) and repaired tubulin reporter (cyan). MT mixture was supplemented with 2 μM Alexa647-tubulin (cyan), 10 mM GTP, and 10 μM taxol were allowed to incorporate at damaged sites for 3 hr at 37°C alone (i) or with (ii) 1 μM Abl2-eGFP. Fluorescence intensities of MT and 647-tubulin were plotted. Dashed magenta line denotes the MT intensity threshold (mean normalized fluorescence intensity) to distinguish healthy from damaged segments. Dashed cyan line denotes the reporter intensity threshold to score whether 647-tubulin reporter is present or not. Scale bar, 3 μm. (D) Total tubulin reporter fraction per MT was quantified per storage condition in the presence or absence of 1 μM Abl2-eGFP. Data are mean ± SEM. n ≥ 50 filaments analyzed per condition. Wilcoxon rank sum test. *, p < 0.05; **, p < 0.01. (E) Total number of repair/incorporation events per MT was quantified per storage condition in the presence or absence of 1 μM Abl2-eGFP. n ≥ 200 incorporation events analyzed per condition. Data are mean ± SEM. Wilcoxon rank sum test. ***, p < 0.001. (F) Representative kymographs of dynamic MT filaments in presence of 10.5 μM rhodamine tubulin alone, or with 0.5 μM 688-924-eGFP, Abl2Δ688-790, or Abl2-eGFP. Yellow arrow denotes a rescue event. Scale bar, 8 μm. (G) Rescue frequencies (fres) were quantified for 10.5 μM rhodamine tubulin alone, or supplemented with 0.1, 0.25, and 0.5 μM 688-924-eGFP, 0.5 μM Abl2Δ688-790, or 0.5 μM Abl2-eGFP. Data are means with 95% CI as black lines. Wilcoxon rank sum test. ****, p < 0.0001. (H) MT lifetime distributions of filaments grown in presence of 0.5 μM Abl2-eGFP (blue), 0.5 μM 688-924-eGFP (red), and 0.5 μM Abl2Δ688-790 (green) relative to tubulin alone (black). Gamma distributions were fit to MT lifetime histograms, shown in solid blue, red, and green curves respectively, relative to tubulin control (solid black). Mean MT lifetimes are denoted as dashed lines. (I) Severing assays performed in TIRF chambers containing biotinylated, rhodamine GMPCPP-stabilized MTs (pseudo-colored magenta) with or without 1 μM Abl2-eGFP supplemented with 90 nM spastin and 2 mM ATP. Representative time series of MTs are shown. Intensity decay curves of severed MTs quantified in (J). Scale bar, 3 μm. (J) Mean intensity decays of MTs in absence (black) and presence of 1 μM Abl2-eGFP (magenta) shown in scatter dots, and SEMs shown as wider shadowing, respectively. Single exponential decay curves were fit to the data, shown as dashed lines. n ≥ 200 filaments analyzed per condition. See also Figure S5.
