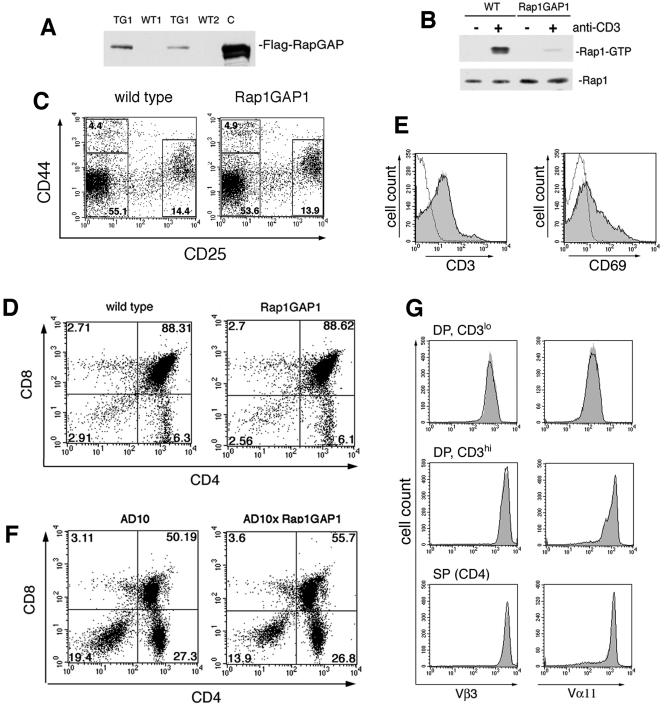
FIG. 3.
Expression and function of Flag-Rap1GAP1 in murine T cells. (A) Immunoblot detection of the Flag-Rap1GAP1 transgene in murine T cells. Cell extracts from equal numbers of thymocytes from wild-type (WT1 and WT2) and transgenic littermates (TG1 and TG2) were analyzed by immunoblotting with Flag-specific antibodies. Lysates from Jurkat cells transfected with the Flag-Rap1GAP1 construct were included as a control (C). (B). Rap1 activation is blocked in Rap1GAP1-transgenic T cells. Following stimulation of wild-type (WT) and Rap1GAP1-transgenic (Rap1GAP1) T cells by anti-CD3 cross-linking, active Rap1 (Rap1-GTP) was pulled down from cell extracts and analyzed by immunoblotting with Rap1-specific antibodies. Total Rap1 in cell extracts is indicated as a loading control. (C) DN thymocyte maturation is normal in Rap1GAP1-transgenic mice. Thymocytes from wild-type and Rap1GAP1-expressing mice were analyzed for expression of CD44 and CD25. Cells were gated on the CD4−CD8− DN population, and the numbers represent percentages of the gated thymocyte subsets. (D) Normal distribution of CD4 and CD8 subgroups in Rap1GAP1-transgenic mice. Thymocytes from wild-type and Rap1GAP1-transgenic mice were stained to show expression of CD4 and CD8. The percentage of T-cell subsets is shown in each quadrant. (E) CD3 and CD69 expression is normal in the Rap1GAP1-transgenic mice. Overlay histograms show CD3 (left panel) and CD69 (right panel) expression on DP thymocytes from wild-type (black line) and Rap1GAP1-transgenic (gray fill) mice compared to control staining (dotted line). Data are representative of results of three experiments. (F) Normal distribution of CD4 and CD8 DP and SP subgroups in AD10 and AD10xRap1GAP1 mice. Thymocytes were stained to show expression of CD4 and CD8. The percentage of T-cell subsets is shown in each quadrant. (G) Normal expression of TCR in AD10 and AD10xRap1GAP1 thymocytes. Overlay histograms showing expression of Vβ3 (left panels) and Vα11 (right panels) on thymocytes from AD10 (black line) and AD10xRap1GAP1 (gray fill).

