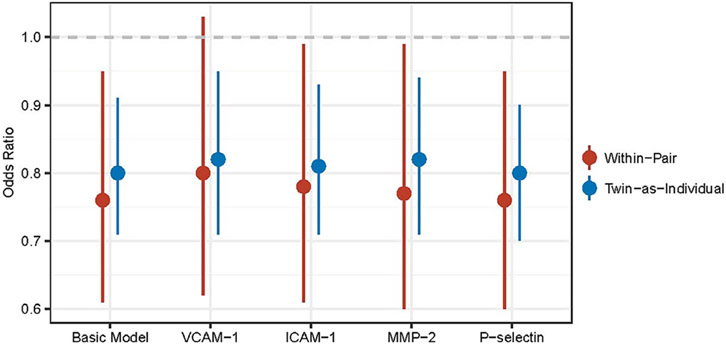
Fig. 1.
Association of TXNIP-cg19693031 methylation with type 2 diabetes (T2D, adjusted for levels of individual inflammatory biomarkers). Odds ratio is represented by a dot; 95% CI is represented by each vertical line; lines that do not cross null effect (dashed line in grey) indicate statistically significant results; within-pair is the effect of nonshared measured influences; twin-as-individual is the effect of overall measured influences. In the basic model, BMI, current smoking status, age and proportions of PBL subtypes (B cells, granulocytes, monocytes, NK cells and T cells) were included as covariates, with T2D treated as the outcome. The other four models were constructed by adding inflammatory biomarkers one at a time into the basic model. Odds ratios for diabetes are per 1% increase in DNA methylation.

