
FIGURE 2. Proportion with viral load <50 copies per mL and <1000 copies per mL following randomization.
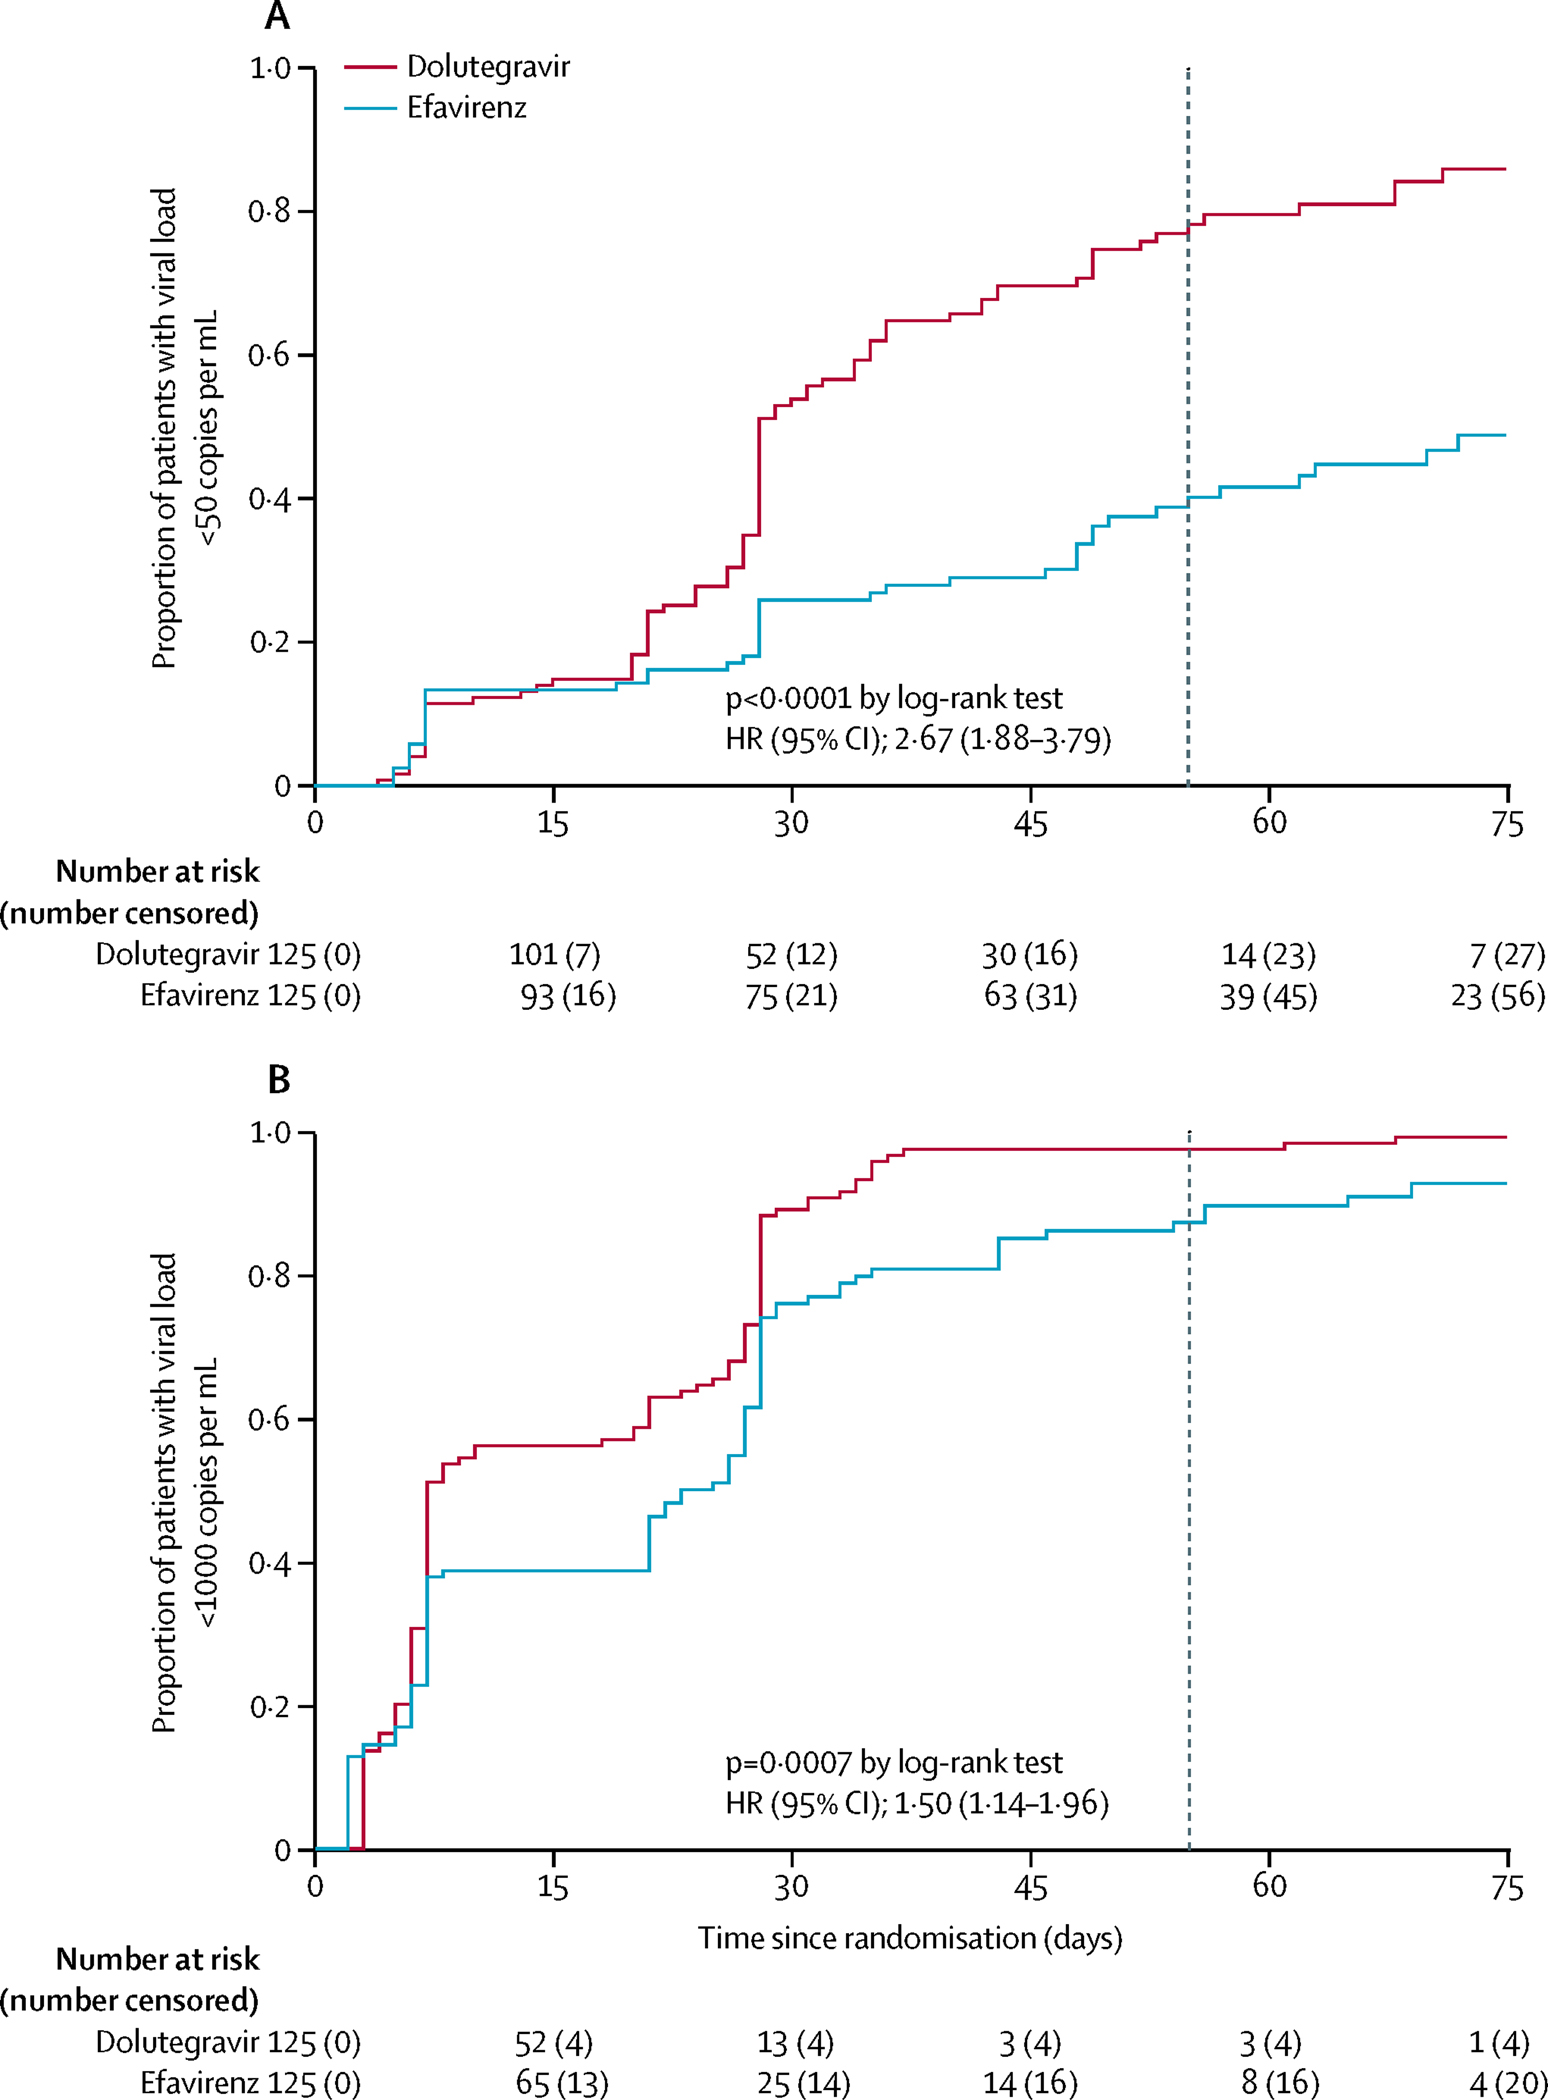
Kaplan-Meier plots of time from randomization to HIV viral load (a) <50 copies per mL and (b) <1000 copies per mL. Dashed vertical line in each plot represents the median time from randomization to delivery (55 days) in the total trial population.