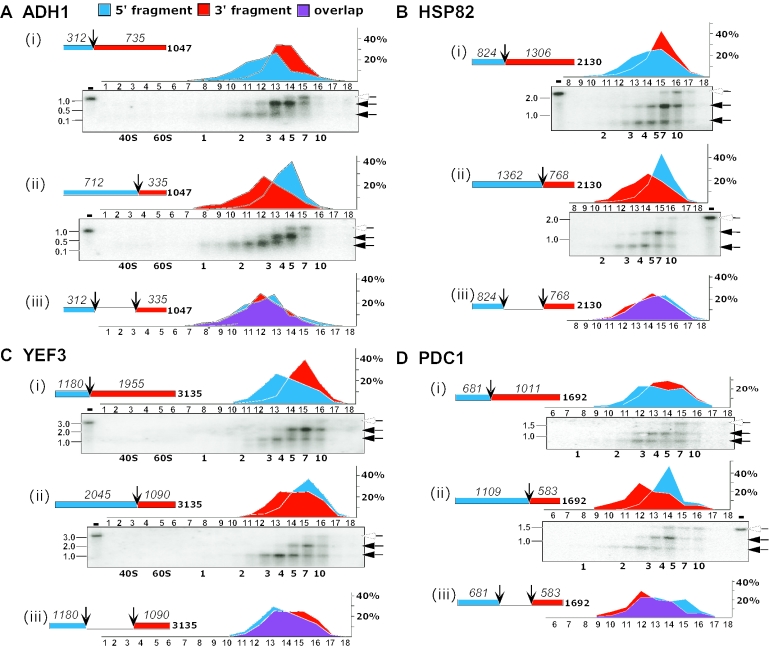
Figure 6.
Comparison of the ribosomal density at the ends of individual mRNAs. Polysomal mRNA was isolated from yeast cells and RNase H-cleaved in the presence of antisense ODNs complementary to positions at the 3′ end of the first third [(i) in each panel] and the second third [(ii) in each panel] of the coding region. Schematic representations of the coding region and the expected sizes of the cleavage products are shown for each mRNA. Samples were separated on sucrose gradients and, in all cases, 18 fractions were collected. The fractions indicated in each panel were subjected to northern analysis and hybridized with radiolabeled probes recognizing ADH1 (A), HSP82 (B), YEF3 (C) and PDC1 (D). Labeling is as in Figure 4. The graphs in (i) and (ii) of each panel show the phosphorimager quantification results of the 5′-cleavage product (blue) and the 3′-cleavage product (red), expressed as percent of total signal in the probed fractions. The graph in (iii) presents the signals of the short fragments from (i) (blue) and (ii) (red) with the overlap shown in purple.

