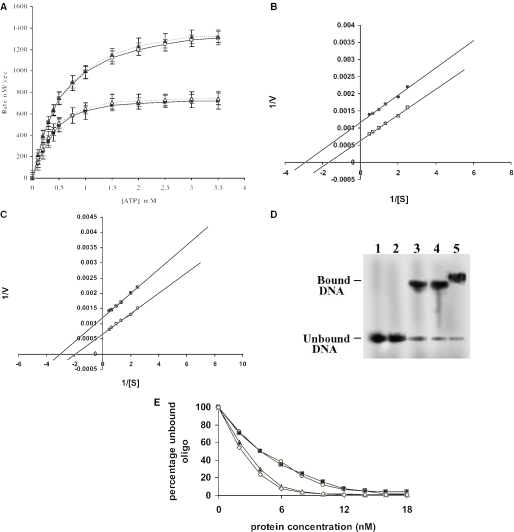
Figure 2.
Properties of the mutant proteins. (A) Dependence of ATPase rate of the 116 and 137 kDa protein on ATP concentration at constant enzyme concentration. 116 kDa (open square), 137 kDa (black triangle) in presence of DNA, 116 kDa (black square), 137 kDa (open triangle) in absence of DNA. The data shown are mean ± SD of three independent experiments. (B) The KM was calculated from the Lineweaver–Burk plot, 116 kDa in absence (open square), and in presence (black circle) of DNA respectively. (C) 137 kDa in absence (open circle) and in presence (black square) of DNA respectively. (D) DNA-binding activity of the truncated LdTOP2 proteins. Lane 1, labeled 36mer duplex oligonucleotide; lanes 2–5, 36mer oligonucleotide incubated with 40, 70, 89 and 116 kDa. (E) Graphical representation of the native gel shift assay. The percentage of unbound oligonucleotide present in gel was quantified by film densitometry and plotted against protein concentration. The kd value was calculated from this graph, core (open circle), LdΔC1058 (black triangle), LdΔN429 (black square) and 137 kDa (open diamond) respectively.

