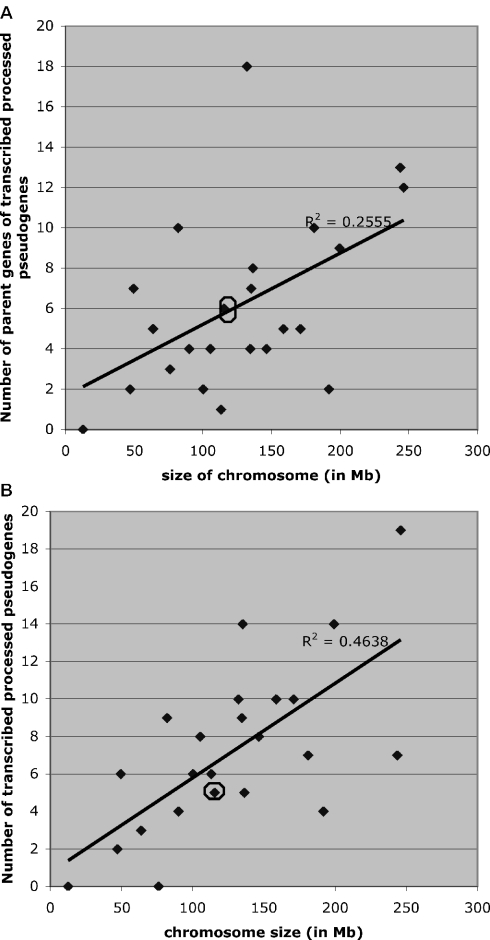
Figure 1.
Origination and deposition of TPΨgs for different chromosomes. (A) Origination of TPΨgs: this plot shows the number of parent genes of TPΨgs in a chromosome versus the chromosome size (in Mb). (B) Deposition of TPΨgs: this shows the number of TPΨgs per chromosome versus chromosome size (in Mb). Only retrotranspositions from one chromosome to another are considered in each plot. The X chromosome is ringed. Note that for each plot we have corrected for the probability of X and Y chromosome inclusion in gametes [i.e. the size of X is multiplied by 0.75 and Y by 0.25; for comparison see figure 1 in (13)].

