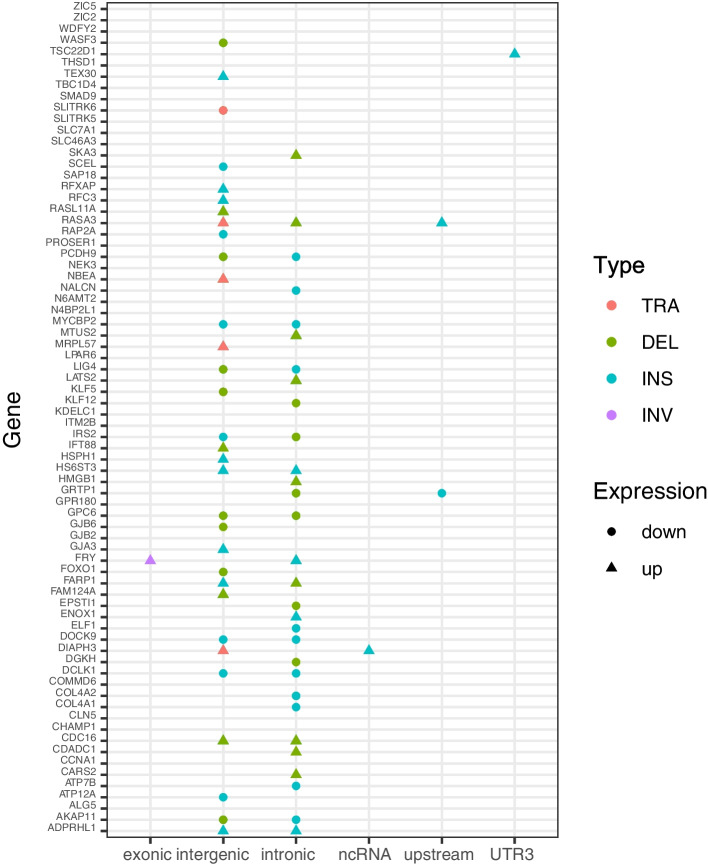
Fig. 3.
Distribution of SVs among Differentially Expressed Genes on Chromosome 13 in SiHa Cells. The x-axis represents the different regions of the genome, including exonic, splicing, ncRNA, UTR5, UTR3, intronic, upstream, downstream, and intergenic regions. The y-axis shows the differentially expressed genes. Different types of SVs are represented by different colors: TRAs (rose red), DELs (dark green), INSs (dark cyan), and INVs (pale purple). The upregulated genes are denoted by triangles, while the downregulated genes are represented by circles

