
Figure 7.
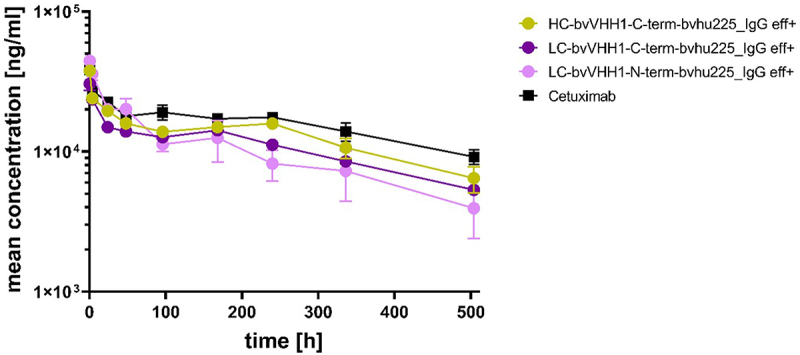
VHH location induce different pharmacokinetic profiles of bispecific EGFR x NKp30 NKCEs. Mouse plasma concentrations of bispecific eff+ NKCEs and cetuximab were measured over time after single intravenous administration of 3 mg/kg of the indicated molecules. Mean concentrations ± SEM of 3 specimen per sample are shown for cetuximab (black), HC-bvVHH1-bvhu225_IgG eff+ (ocher), LC-bvVHH1-N-term-bvhu225_IgG eff+ (pink) and LC-bvVHH1-C-term-bvhu225_IgG eff+ (purple) as determined by ELISA.