FIG. 4.
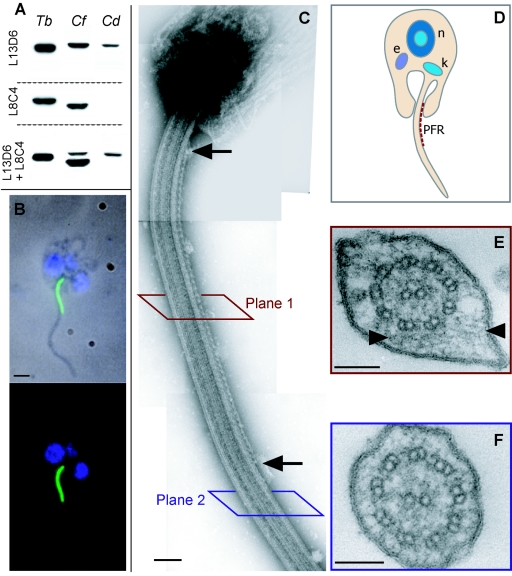
The PFR of C. deanei. (A) Western blot analysis of major PFR proteins. Protein samples from 0.5 × 10⁷, 1 × 10⁷, and 2 × 10⁷ cytoskeletons of T. brucei, C. fasciculata, and C. deanei, respectively, were separated by SDS-PAGE and analysed with MAb L13D6 (reacts with PFR1 in Crithidia spp. and with PFR1 and PFR2 in T. brucei) or MAb L8C4 (reacts with PFR2 only). A Western blot using both MAbs together is also shown. Note that PFR1 and PFR2 of T. brucei are not resolved on these blots. (B) Phase-contrast microscopy and corresponding immunofluorescence image for a C. deanei coanomastigote. DNA is labeled with DAPI (blue), and the PFR is identified by MAb L13D6 (green). Scale bars, 1 μm. (C) Ultrastructure of C. deanei PFR visualized by TEM of negatively stained whole-mount cytoskeletons. Arrows show the limits of the PFR structure along the flagellum. Scale bar, 200 nm. (D) Schematic representation of C. deanei showing the position of the PFR (also the kinetoplast [k], nucleus [n] and endosymbiont [e]). (E and F) TEM on thin sections reveal a putative PFR structure (arrowheads) in some sections (E), but much of the flagellum is free of PFR (F). Scale bars, 100 nm.

