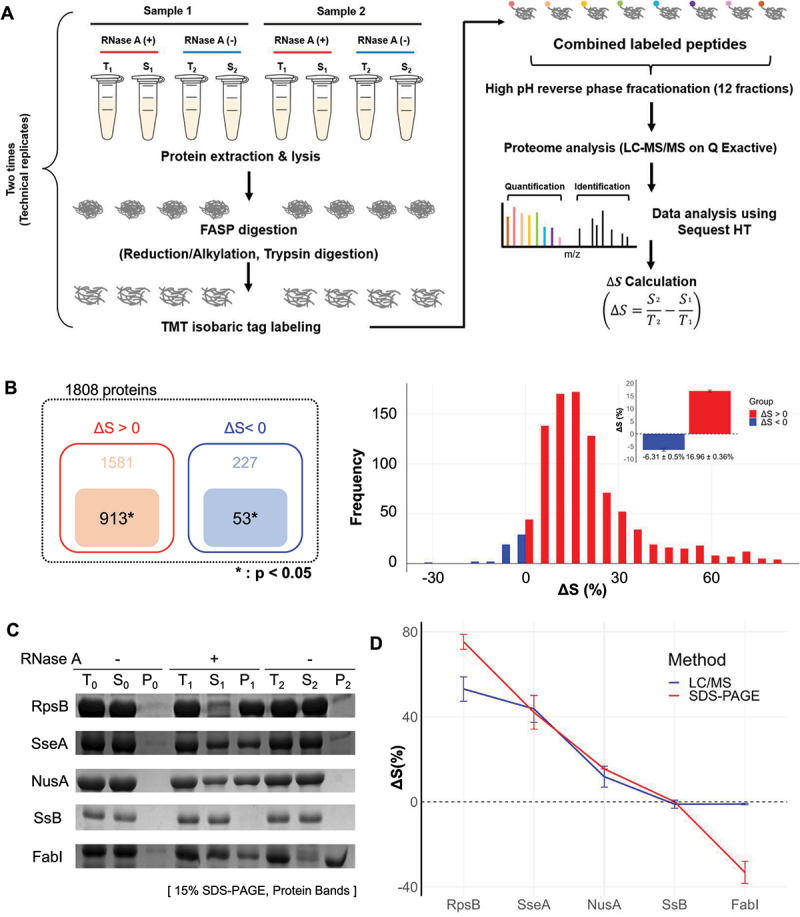
Figure 2.

Proteome-wide analysis of proteins responsive to RNA degradation via mass spectrometry. (A) Schematic representation of the tandem LC-MS/MS procedure utilized in combination with TMT for quantitative analysis of protein solubility under conditions with and without exogenous RNase treatment. For further details, refer to the materials and methods section. The solubility difference (ΔS) for each protein is defined as the solubility in the control group (S2/T2) minus the solubility in the RNase-treated group (S1/T1). ‘Sample 1’ and ‘Sample 2’ refer to lysates from two distinct cell cultures, underscoring the use of biological replicates in the study. (B) The number of identified proteins by mass spectrometry (left panel) and their frequency distribution as a function of ΔS (right panel). A total of 913 proteins with ΔS>0 and 53 proteins with ΔS<0 were identified, all with statistical significance (p<0.05). Of the proteins analysed, 913 showed ΔS>0 and 53 ΔS<0, each group identified with statistical significance (p<0.05). The histogram of ΔS distribution (bin size: 5%) indicates an average ΔS of 16.96% (SE ±0.36%) for proteins with ΔS>0 and−6.31% (SE ±0.5%) for proteins with ΔS<0. SE is used throughout this paper unless otherwise mentioned. (C) SDS-PAGE analysis of ΔS for individually overexpressed proteins RpsB, SseA, NusA, SsB (ΔS>0), and FabI (ΔS<0). The ΔS values obtained for each protein were used to validate the corresponding ΔS values determined by mass spectrometry in E. coli lysates. (D) Comparative analysis of ΔS between mass spectrometry (red square) and SDS-PAGE (blue circle) analyses. This comparison evaluates the ΔS values in overexpressed proteins from part (in Figure 2C) against those obtained by mass spectrometry in E. coli lysates. The ΔS values in overexpressed proteins and mass spectrometry were obtained from three and four independent experiments, respectively.
