
Figure 5.
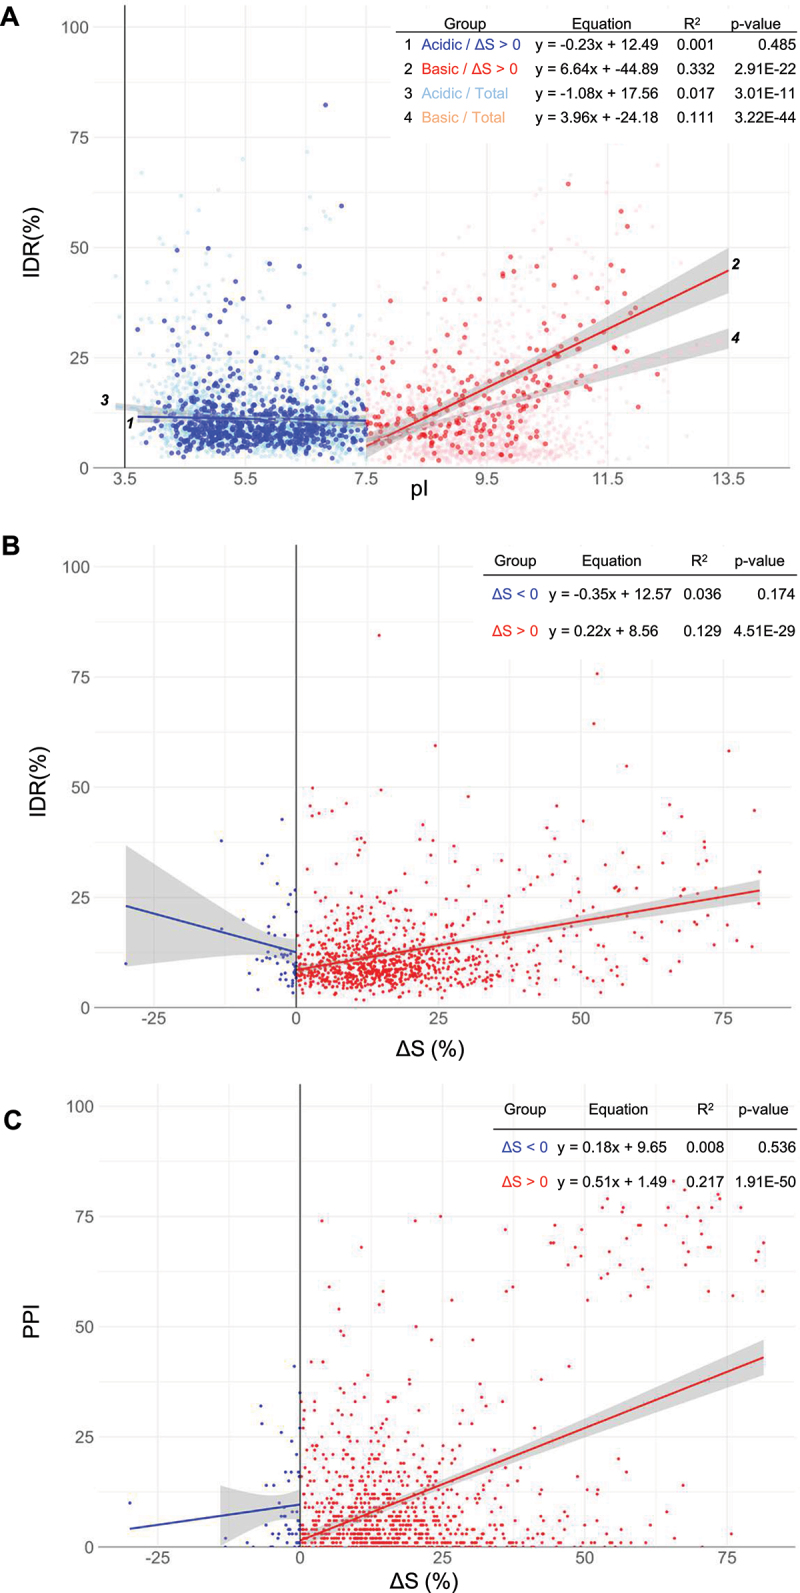
Analysis of the interplay between intrinsic disorder, pI, ΔS, and PPI. (A) Plot between IDRs and pI for acidic and basic proteins of proteins (ΔS > 0) and total proteome. 4302 proteins of the total proteome are depicted with grey spots and a black dotted line as a background reference. (B) Plot between IDR against protein solubility change (ΔS) for proteins with ΔS > 0 and ΔS < 0. (C) A correlation plot between PPI, as determined by a STRING score with a threshold of 0.900, and ΔS for proteins with ΔS > 0 and ΔS < 0. The linear regression equation, p-value, and R2 (coefficient of determination) values for each fitting are provided within the figure data.