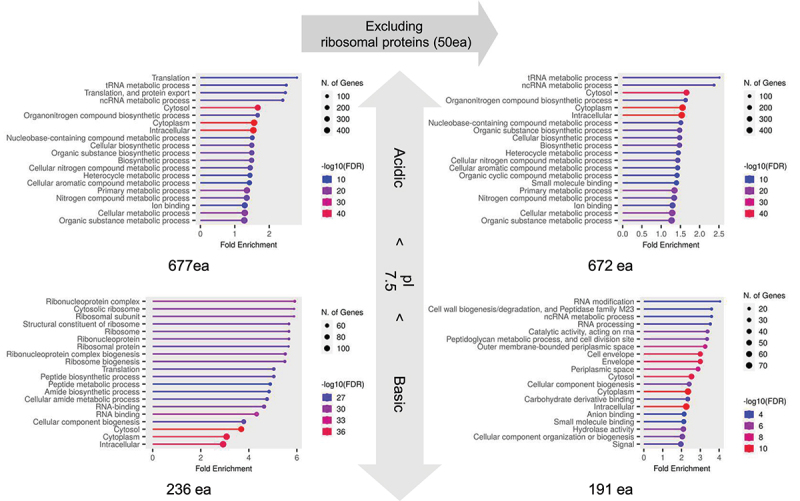
Figure 6.

GO analysis between acidic and basic RNA-dependent proteins. This analysis categorizes 913 proteins with ΔS > 0 into 677 acidic and 236 basic proteins, each compared against the background of their respective acidic and basic proteins in the E. coli proteome. Further analysis was conducted on subsets (672 acidic and 191 basic proteins) after excluding 50 ribosomal proteins. The top 20 enriched GO terms were displayed for each group.
